Compare Sales Performance Based on Go-To-Market Platform Usage
Get the recipe for maximizing GTM platform usage for optimal B2B sales performance and ROI

The tie between B2B sales performance and go-to-market platform usage
In today’s economic climate, showing direct ways to impact ROI is not a nice to have; it’s a must.
Businesses are more cautious about spending money. A clear and direct return on their investment is essential as more companies are focusing on initiatives that they can measure and track ROI.
For several years, C-suites have consistently ranked sales and marketing alignment as their top challenge.
Case in point: 87% of sales and marketing leaders say collaboration between sales and marketing enables critical business growth (LinkedIn, 2020).
This recipe highlights correlations between using a go-to-market platform (like Demandbase One™) and sales reps closing and winning more deals. Power users of any GTM platform outperform their peers because they’re able to provide more relevant, timely, and valuable experiences … to the right people at the right accounts.
Access to high-quality, comprehensive contact and account data is the difference maker.
How understanding sales usage of a GTM platform impacts ROI
Sales leaders are coaches — guiding the team, providing strategies for each play, ensuring the team is well-prepared, and helping them to overcome challenges “in the field.” They work with reps to optimize their potential and to train every rep to perform as well as their best, often top-grossing, rep.
Marketing leaders are strategists or “game planners.” They research the market, enticing potential buyers to “download now” or “learn more” as they attempt to get them in the funnel … and then move them to an MQL.
Their job is to better align and enable sales reps to close more deals as quickly as possible … to understand and replicate the behavior of top-performing sellers to help them close the performance gap while improving sales and marketing alignment.
Using a go-to-market platform increases the odds of this ever-so-important alignment.
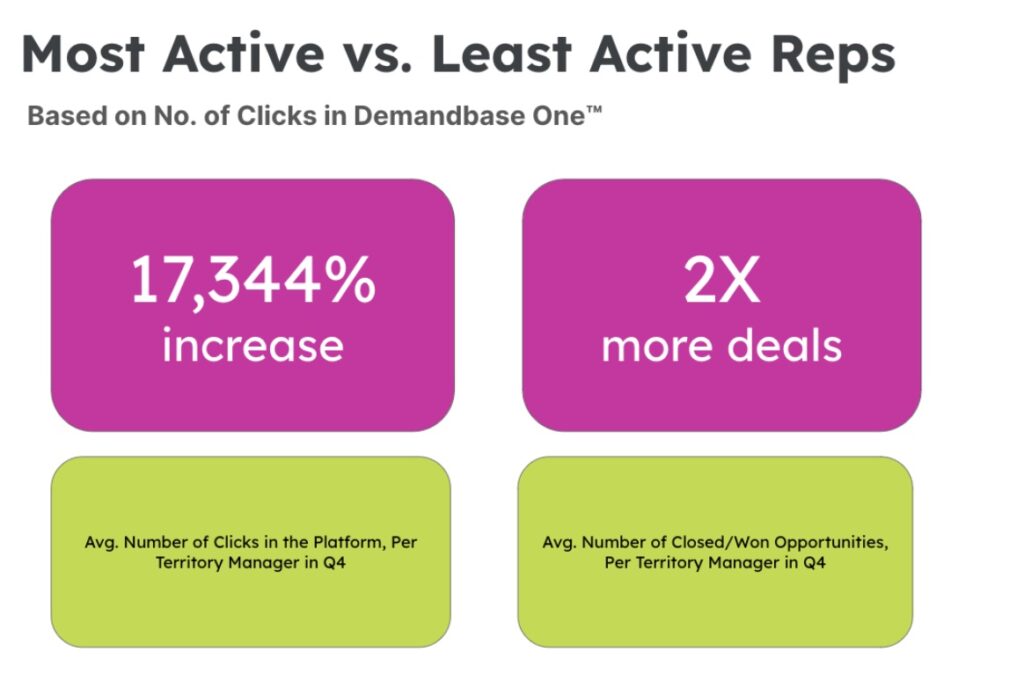
A recent customer found that their most active reps using Demandbase One™ closed 2x more deals than less active users.
Top-performing organizations spotlight and feature sales reps who see the best results — emails, team meetings, Slack or Teams shoutouts, on the intranet, etc. Those communications showcase the habits and behaviors of the elite reps and often turn into best practices for others to emulate.
Understanding the correlation between platform usage and sales performance gives us the ability to refine how sellers are using the platform, what data they’re acting upon, and when and how frequently they’re reviewing the contact and account data that’s available.
The complexity of this analysis increases with the complexity of your sales organization.
Many variables impact sales outcomes. When analyzing the relationship between go-to-market platform usage and sales outcomes, it is crucial to consider and control as many variables as possible.
While there may not be perfect cause and effect (or even correlation), the goal is to seek out opportunities to directionally improve performance, enablement, and alignment.
Try this 5-step approach in your office
Here’s what you can do in your office today to try this recipe.
Note: We’ll be providing steps assuming you are using Demandbase One™. If you are not, just replace “Demandbase One™” with your current GTM platform.
- Analyze product usage: Gather rep usage data to understand how well they use all the data and insights available. This may include some (or all) data from your website, email communications, phone activity, CRM, and Slack/Teams.
- Pull opportunity data: Use an Opportunity List (what we call it in Demandbase One™) to understand all per rep opportunity metrics and data.
- Segment reps by product usage: Group sales reps and their corresponding metrics into two user segments: (1) most active and (2) least active users.
- Calculate key metric differences: Start by comparing average opportunities won per rep for the most and least active users. Note: We suggest starting here, but you can run this through any/all sales metrics.
- Communicate and drive improvement: Use these insights to highlight the increased performance of reps who use the GTM platform the most. Socialize this among your team to encourage this best practice across the broader team.
“We want all our AEs, CSMs, SDRs, SEs, and leaders to be as successful as possible. We know that we see more success when we use Demandbase One™. Territory planning, account strategy, and deal acceleration all get easier when we’re each using the great data and insights we have available to us. Personally, I want everyone to be in the Most Active segment of Demandbase One™ users because I know what that means for our business.”
Related content


We have updated our Privacy Notice. Please click here for details.