The right way to measure account-based marketing for modern ABM success
Learn about account-based marketing metrics and why they’re superior to traditional GTM metrics like leads and opportunities.

B2B CMOs around the world have made great strides in improving marketing analytics. But with the rise of account-based marketing (ABM), B2B marketers need new metrics — ABM metrics — to guide how they measure and prove the ROI of their ABM campaigns.
Why ABM analytics are different than traditional demand generation analytics
While leads and opportunities are essential B2B marketing metrics, they are insufficient to measure the success of an account-based marketing strategy.
ABM requires specialized account-based metrics. Here’s why:
- ABM occurs at every stage of the funnel, unlike lead-based metrics, which are overly focused on net-new business creation.
- ABM takes time to show results, meaning we need metrics that show real progress within big, complex deals throughout the sales cycle.
- ABM metrics are about quality, not quantity. As the focus shifts to engaging high-value accounts, quantity-based metrics (such as leads) may go down.
What metrics matter in ABM?
There are three main categories of tracking and measuring your ABM success:
- Engagement: Am I creating and deepening relationships with key accounts?
- Journeys: How do accounts move through their buying journeys to desired outcomes (e.g., pipeline and revenue)?
- Attribution: Which marketing activities work? What’s the return on investment of my marketing campaigns?
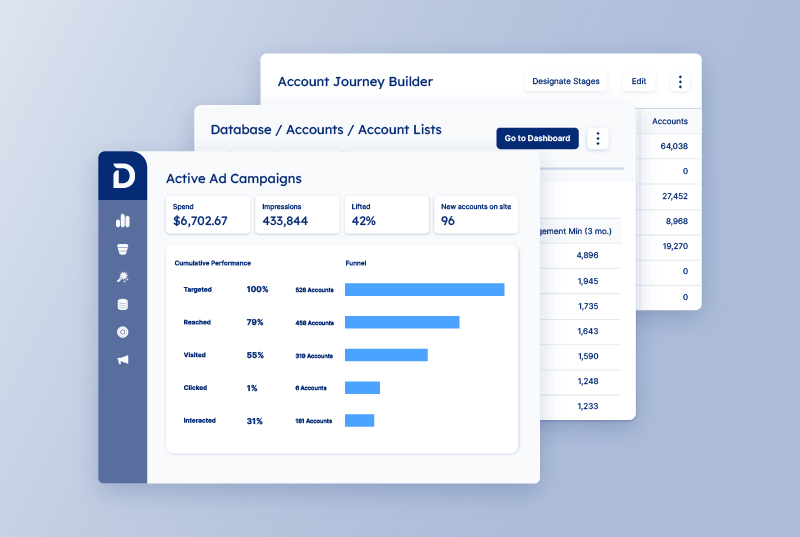
Engagement analytics
Sales reps want relationships with the right people at the right accounts. They want key decision-makers and stakeholders to know who your company is when they call.
That’s why engagement analytics is an ABM metric that measures relationship quality, not quantity. They answer one fundamental question: Are we creating and deepening relationships with key accounts?
To measure how you’re creating and deepening relationships, measure where target accounts spend time, as well as how engagement increases over time. Don’t just look at traditional website analytics — drill into all activities, including attending events and taking sales meetings.
Deeper engagement means deeper commitments.
Examples
- Account Engagement Score: A composite score that combines various engagement signals (website visits, content downloads, event attendance, email interactions, etc.) to provide an overall view of an account’s level of engagement.
- Key Contact Engagement: Measures the interactions of specific decision-makers within target accounts, such as their participation in webinars, meetings, or social media interactions.
- Content Consumption by Account: Tracks which content pieces (white papers, case studies, blog posts) are being consumed by target accounts, indicating their areas of interest and pain points.
- Sales Meeting Participation: Monitors the frequency and quality of meetings between sales reps and key contacts within target accounts.
- Social Engagement: Measures interactions on social media platforms, such as mentions, shares, and comments from target accounts.
Related: Buyer Intent Explained: Why It Matters & How To Use It
Journey analytics
In a perfect world, we’d only need to measure revenue. It’s the one ABM metric everyone agrees on. But while revenue is the holy grail, ABM also requires leading indicators to show progress during long sales cycles.
For this, B2B marketers define stages of the buyer journey and measure funnel dynamics using the key metrics of balance, volume/flow, conversion, and velocity. These leading indicators show when, how, and why target accounts become aware, engaged, qualified, closed, and more.
Fundamentally, these kinds of ABM metrics answer one question: How do accounts move through the buying journey to produce outcomes we care about?
Examples
- Account Progression Through Stages: Tracks the movement of target accounts through defined stages of the buying journey (e.g., Awareness, Engagement, Qualified, Closed).
- Stage Conversion Rates: Measures the percentage of accounts that successfully move from one stage to the next, identifying bottlenecks in the sales funnel.
- Account Velocity: Calculates the average time it takes for an account to move through each stage of the buying journey, highlighting areas where sales cycles can be accelerated.
- Pipeline Contribution by Stage: Shows the value of pipeline generated from accounts at each stage of the buying journey, providing insights into the effectiveness of different marketing and sales activities.
- Opportunity Win Rate by Account Tier: Displays the percentage of won opportunities from accounts in different tiers, allowing to compare ABM effectiveness between tiers.
Attribution analytics
Perhaps the most common marketing question is, Did my programs have an impact? ABM practitioners use attribution analytics as an ABM metric to make better decisions about budget allocation. By investing in the highest-performing programs, they maximize overall return by answering one fundamental question: What is the return on my marketing investment?
For example, when looking at ROI metrics for Journey Stages, Demandbase One™’s Journey Stage analytics can be used to track account progression, conversion rate, and velocity. You can even compare results for accounts receiving an ABM approach vs. a demand gen approach to evaluate success (spoiler alert – According to TOPO, opportunities from accounts receiving an account-based approach closed at 53% versus 19% for demand generation).
Examples
- Marketing-Influenced Pipeline: Measures the amount of pipeline that can be directly attributed to marketing activities, demonstrating the impact of marketing efforts on revenue generation.
- Return on Investment (ROI) by Campaign: Calculates the profitability of specific ABM campaigns by comparing the revenue generated to the cost of the campaign.
- Cost Per Influenced Opportunity: Determines the cost of generating a qualified opportunity through marketing activities, providing insights into the efficiency of different campaigns.
- Attribution by Content Type: Identifies which content types (e.g., webinars, ebooks, case studies) are most effective in driving pipeline and revenue.
- Account-Based Return on Ad Spend (ROAS): Measures the revenue generated for every dollar spent on account-based advertising campaigns.
So you see, vanity, activity, and cost are not the metrics we should be focusing on. We need to put actionable ABM metrics into place. Marketers who use ABM metrics — like engagement, journey, and ROI analytics — speak the same language as other executives.
By effectively quantifying marketing’s value, you earn budget, gain credibility, and deliver high performance. This process of demonstrating marketing’s value also allows us to benchmark our progress, and to optimize our ABM efforts for maximum impact.
Interested in learning more about the specifics of which metrics matter when it comes to a strategic assessment of ABM initiatives?
Check out this webinar: Leadership Series: Reporting Best Practices
Additional ABM metrics you should consider tracking
While engagement, journey, and attribution metrics form the core of ABM measurement, several additional metrics provide crucial insights into the overall health and effectiveness of your ABM strategy. These metrics help you understand the long-term value of your accounts, the efficiency of your sales process, and the overall impact of your ABM efforts.
- Number of Target Accounts: This metric tracks the total number of accounts you’ve identified as high-value targets for your ABM program. It provides a clear view of the scope of your ABM efforts and allows you to monitor changes in your target account strategy over time. Ensuring that you are focusing on the correct number of accounts is critical to the success of your ABM program.
- Customer Acquisition Cost (CAC): CAC represents the total cost of sales and marketing efforts required to acquire a new customer account. In ABM, tracking CAC helps you understand the efficiency of your targeted campaigns and ensures that the cost of acquiring high-value accounts aligns with their potential revenue. It is very important to track that CAC is lower than CLV.
- Customer Lifetime Value (CLV): CLV predicts the total revenue a business can expect from a single customer account throughout the duration of their relationship. In ABM, where you focus on high-value accounts, CLV helps you justify the investment in personalized marketing and sales efforts. It demonstrates the long-term return potential of your target accounts.
- Pipeline Velocity: This metric measures how quickly accounts move through your sales pipeline. ABM aims to accelerate the sales process for key accounts. Tracking pipeline velocity helps you identify bottlenecks and optimize your strategies to shorten the sales cycle and improve deal closure rates.
- Sales Cycle Length: This metric tracks the average time it takes to convert a target account into a paying customer. Monitoring the sales cycle length allows you to assess the efficiency of your ABM campaigns and identify areas where you can improve the speed of deal closure.
- Average Deal Size: This metric represents the average value of closed deals with your target accounts. ABM focuses on high-value accounts, so tracking the average deal size helps you measure the financial impact of your ABM efforts and ensure that you’re targeting accounts with significant revenue potential.
- Churn: Churn measures the rate at which target accounts stop doing business with your company. ABM focuses on building long term relationships, and therefore decreasing churn is very important. Tracking churn allows you to see if your ABM efforts are contributing to customer retention and long term customer satisfaction.
The three elements of an effective ABM metric
Good rules to follow when choosing metrics should help drive actionable change in your sales campaigns, moving the needle in the right direction. Before you create the perfect ABM campaign, you need to know your goals and how you’re going to measure success. To track its success, you need to understand what makes a good metric in the first place.
Here are the three things that make a good metric:
- A good metric is comparative. A comparison across time periods, lead segments and sources, and account owners shows what the numbers actually mean.
- A good metric is a ratio. Ratios are easy to act on. They also give insights into the relationship between seemingly opposed factors.
- A good metric changes behavior. When a metric is a simple number that causes changes in the bottom line, you can act on insights.
Five steps for measuring ABM account engagement
Are the right people at the account engaging with your brand? And is that engagement going up over time?
Engagement covers when your ICP responds to your marketing programs, interacts on LinkedIn, uses your product, and talks with the sales team. By combining these interactions at the individual and account levels, we get a good proxy for engagement.
Here are the main considerations when measuring engagement at high-value accounts:
1. Track activities
Track all the meaningful activities for each of the contacts at your target accounts.
Typically, the data sources will include:
- Website: Visits by account using reverse-IP mapping.
- Marketing automation: Email opens, event attendance, content downloads, interesting moments, and so on.
- CRM: Activities, tasks, and campaign membership.
More advanced data sources include:
- Product: Minutes spent using various features of your product.
- Social media: Who follows you, shares and retweets your content, comments on your posts, and so on.
- Sales interactions: Tracking when sales spends time with target accounts. (This is the hardest, but one of the most valuable sources.)
Many sales tools track interactions (such as email) as activities in the CRM tool, so those are straightforward to pull in. We can also connect to a sales rep’s calendar and corporate email to track when they are having meetings and other interactions with target accounts.
Count the meetings. A great ABM metric is to count the number of meetings scheduled and held at target accounts. Just make sure you have in place a good mechanism to track these!
2. Match activities to target accounts
Take each lead’s activity and identify which account he or she should be part of. You can manually do a simple match on email domain or automate it with technology like Demandbase that uses more sophisticated methods for lead-to-account matching. Getting this right is a critical step in all ABM analytics.
3. Assign minutes to activities
Take each of the various activities and assign a number of minutes to each. You often won’t have the exact number of minutes, so it’s OK to use estimates for each activity type, such as:
- Email open: 1 minute
- Content download: 10 minutes
- Webinar attendance: 30 minutes
- Dinner attendance: 2 hours
Visualize all the activities into an account timeline.
It’s often useful to map all the key activities for a given account into a visual timeline. This can be especially valuable to have during a quarterly business review to show precisely how marketing has touched the account. It’s also useful when a deal closes to look back and see the touches that helped influence the account.
4. Create an organizational heatmap
To create an account heatmap, track which parts of the organization are engaging with you. Add up the number of minutes spent in total from each cell of the matrix and color code for their engagement level. You can also do this for a group of accounts to see broader trends. With this data visualization, you can identify which personas are most engaged (darker areas on your heatmap) and where you need to deepen engagement (lighter spots). Use the heatmap to see which parts of the organization engage with you and where you may have blind spots.
You can also:
- See where you may need new content to engage different audiences.
- Identify potential blind spots. Although it’s always important to focus on your top contacts at an account, it’s also important to have the necessary breadth of relationships. By comparing an account’s heatmap with your ideal heatmap, you’ll be able to see where you may be missing engagement from a key persona.
5. Aggregate engagement at the account-level, and identify marketing-qualified accounts
Combine the minutes for all the contacts at an account to come up with a measure of aggregate account-level engagement. This combination is typically not a simple sum or average. For example, sometimes you’ll want to give more weight to senior or important contacts.
From there, track the aggregate engagement trend over time, similar to an electrocardiogram (EKG) chart for account health.
Imagine being able to go to the head of sales to show that target accounts spent 4,289 minutes engaging with marketing activities this quarter, up 122 percent from only 1,932 last quarter. And imagine being able to drill into the data to show the specific sales territories, industry segments, and personas with the biggest growth. This is certainly a sign that things in the middle of the funnel are progressing in the right direction!
One of the best ways to demonstrate marketing’s impact in ABM, especially in the middle of the funnel, is to show increased engagement from target accounts.
With this insight, you can identify marketing qualified accounts (MQAs). You want to determine which are the most engaged accounts and alert sales about any accounts whose engagement is spiking up or down versus their recent trend.
At Demandbase, we think that account-level engagement is a better indicator of potential buying activity than individual lead scores. That’s why we use a new metric, the marketing qualified account (MQA) instead of the person-based metric, marketing qualified lead (MQL).
Marketing qualified account: An account (or discrete buying center within an account) that has reached enough aggregate engagement in a given time period to merit a sales outreach.
When you accurately track the minutes from your account-based marketing activities, you’ll understand how target accounts are engaging. Over time, you’ll gain valuable information about how engagement points correlate with your most valuable accounts — so you can refine your strategies and create even more engagement.
ABM metrics matter
Account-based metrics, such as those described here, don’t replace traditional lead generation metrics like leads, pipeline, and revenue. Those are still important, and you should track them for both existing and new customers.
But, as we’ve seen, traditional key performance indicators (KPIs) and metrics are not sufficient to measure ABM. So sales and marketing teams should be adept at using additional KPIs and metrics to understand the performance of their ABM strategy.
Take the next step!
If you’ve made it this far, you are well on your way to executing efficient sales and marketing strategies that power revenue growth.
So now what? Here are three things that come to mind:
- See a demo of Demandbase One™ to witness exactly how our go-to-market platform can support your ABM program.
- Take an ABM certification course and show the world you mean business as a modern B2B marketer who understands the value of ABM.
Related ABM topics
If you’re just digging your feet into ABM and looking for pointers on how to build a successful account-based strategy, then “How to ABM Like a Boss” is the definitive blog series for you. No need to read through a stack of posts from a dozen bloggers. This is it. It’s like reading an eBook but in an easier, more digestible way. The blog series covers how to create a budget, build an ABM team, get your data ready, select your target accounts, personalize your content, and measure and realign. Check out the rest of the posts in the series and own your ABM!
Part 1: Build a Budget
Part 2: Establish an ABM Team
Part 3: Get Your Data Ready
Part 4: Select Your Target Accounts
Part 5: Personalize Your Content
Related content


We have updated our Privacy Notice. Please click here for details.