
How to calculate ROI on marketing campaigns
For every dollar spent on marketing, how much revenue or value did you generate in return? Learn how to answer that question in this handy guide.

What is marketing ROI?
Marketing Return on Investment (ROI) is a performance metric used to evaluate the profitability and effectiveness of a marketing campaign.
It answers a fundamental question: “For every dollar spent on marketing, how much revenue or value did I generate in return?”
In simple terms, marketing ROI helps you quantify the financial return from your marketing efforts, giving both marketers and stakeholders a clearer picture of what’s working, what isn’t, and where to optimize.
Why is measuring marketing ROI important?
Justifies marketing spend and budget
In most organizations, marketing is seen as a cost center until proven otherwise. Finance and executive teams are constantly asking: “What did we get in return for this $100K campaign?”
Without clear ROI metrics, marketing teams struggle to defend their budget—especially during periods of economic uncertainty, budget cuts, or annual planning cycles.
However, when you can tie campaigns to pipeline, lead sources to closed-won deals, and channels to revenue contribution, marketing becomes a core revenue function.
For example, when you measure ROI, you’re no longer saying “We got 100K impressions and 5K clicks.” Instead, you say, “We spent $20,000 and generated $80,000 in revenue—a 300% ROI.”
That shifts the narrative from activity-based to outcome-based, which is far more compelling to non-marketing stakeholders.
Drives smarter, data-backed decision-making
Modern marketing is complex, with hundreds of potential channels, tools, and tactics. You can’t do everything. ROI tells you what actually works, so you can focus resources on strategies that deliver.
Let’s say you’re running paid search, SEO, webinars, and LinkedIn ads. If webinars deliver the highest ROI based on lead-to-revenue conversion, you can choose to:
- Shift more marketing budget into webinars,
- Optimize the underperforming channels, or
- Pause low-ROI tactics entirely.
With this, you’re no longer relying on gut instincts or trends, you’re using hard data to guide strategy.
Enables predictive forecasting and strategic planning
When you consistently measure ROI across campaigns and channels, you start to understand patterns in performance.
For example:
- Which content types convert best?
- Which personas generate the most revenue?
- How long does it take from engagement to close?
Using this insight, you can predict revenue impact with far greater accuracy and plan future campaigns with precision, rather than assumptions.
Encourages continuous optimization and learning
Measuring ROI turns every campaign into a learning opportunity. Instead of executing and moving on, your team captures performance data, feeds it into your system, and applies those learnings to the next initiative.
Over time, this becomes a closed-loop feedback system that improves targeting, messaging, and funnel efficiency across the board.
For example, if a social media campaign underperforms in ROI but has high engagement, you might experiment with retargeting that engaged audience with a direct CTA. Or, if a campaign has high ROI but low volume, you might look to scale it while maintaining effectiveness.
Recommended → Discover the Ingredients for ROI Success with Chris Moody
Key components needed to calculate marketing ROI
Before you calculate anything, make sure you’re tracking the right data with the right foundation.
This means having a well-rounded view of all variables that influence both the input (costs) and the output (value generated).
Below are four core components you must account for when calculating ROI on any marketing campaign:
Campaign costs
This is the foundation of your marketing ROI calculation. It’s simply asking the question, ‘how much did you spend?’
- Direct Costs. Ad spend, agency fees, software tools.
- Indirect Costs. Employee hours, creative production, landing page dev.
- Hidden Costs. Overhead, opportunity cost.
Revenue or value generated
This is the “return” side of the ROI equation. And it can take many forms depending on your campaign type (e.g., direct sales, lead generation, or brand awareness).
- Sales from Campaign-Driven Traffic. This applies to direct-response campaigns like eCommerce sales or product-led growth (PLG) conversions.
- Lead Value (For Lead-Gen Campaigns). For B2B or high-ticket B2C campaigns where the conversion happens offline (e.g., demo booking, MQL collection), you need to assign a monetary value to leads.
- Pipeline Influence. For longer sales cycles or ABM campaigns, calculate pipeline influenced (i.e., deals that had touchpoints with the campaign).
Timeframe
Campaigns should be evaluated over a time window that accounts for lead nurturing and deal closure periods.
For example, if your campaign runs for 2 weeks but your average sales cycle is 60 days, immediate ROI reporting will miss future conversions.
Attribution models
Attribution determines how you assign credit to different marketing activities that influenced a conversion. It’s a critical bridge between your efforts and the resulting pipeline or revenue.
For example, if a customer clicked on a Google ad, read a blog, attended a webinar, then converted via a sales email, how do you decide which campaign “earned” the ROI?
The attribution model you choose directly affects:
- Revenue allocation per channel
- Perceived campaign ROI
- Budget decisions moving forward
Common Attribution Models
| Model | Description | Best For |
|---|---|---|
| Last Click | 100% credit to the final interaction before conversion. | Simplicity, quick reporting. |
| First Click | 100% credit to the first touchpoint. | Awareness-focused campaigns. |
| Linear | Equal credit across all touchpoints. | Multi-channel journeys. |
| Time Decay | More credit to recent touchpoints. | Sales-driven funnels. |
| Position-Based (U-shaped) | 40% to first and last touch, 20% split among others. | Balanced mid-funnel journeys. |
| Data-Driven | Machine learning-based model that assigns value based on actual contribution. | Complex, high-volume funnels |
Different ways to calculate marketing ROI
Classic ROI formula (revenue-based)
This is the most commonly used and straightforward method of calculating marketing ROI. It focuses purely on revenue generated vs. money spent.
- Marketing ROI (%) = [(Net Marketing Revenue — Marketing Investment)] / Marketing Investment) x 100
Key metrics included:
- Net Marketing Revenue. Total revenue directly tied to marketing efforts.
- Marketing Investment. The total cost of marketing campaigns, including ad spend, tools, freelancers, and content creation.
Example:
Let’s say you spent $50,000 on a LinkedIn ABM campaign and closed $200,000 in revenue directly attributed to that campaign.
Marketing ROI = [($200,000 – $50,000) / $50,000] x 100 = 300%
Limitations: Doesn’t factor in influence, non-revenue goals (like pipeline), or multi-touch journeys.
Customer acquisition cost (CAC) to LTV ratio
This method compares the cost of acquiring a customer to the lifetime value (LTV) that customer brings. While not a pure ROI formula, it gives you insight into marketing efficiency and profitability over time.
- CAC to LTV Ratio = Customer Lifetime Value / Customer Acquisition Cost
Key metrics included:
- LTV. Average revenue expected from a customer over their full lifecycle.
- CAC. Average cost to acquire one customer (marketing + sales costs).
Example:
If your CAC is $3,000 and your LTV is $12,000:
CAC to LTV = $12,000 / $3,000 = 4:1
This gives you a long-term view of marketing profitability and customer health. A good benchmark is a 3:1 or 4:1 ratio.
Limitations: Less campaign-specific. More useful for assessing overall marketing effectiveness at scale or over time.
Pipeline ROI (opportunity-based)
This method calculates ROI based on pipeline generated, not just closed revenue. It is ideal for longer sales cycles where deals may span months.
- Pipeline ROI (%) = [(Total Pipeline Influenced – Marketing Investment) / Marketing Investment] x 100
Key metrics included:
- Total Pipeline Influenced. The total value of opportunities where marketing played a significant role.
- Marketing Investment. Spend associated with generating that pipeline.
Example:
You ran an ABM campaign costing $20,000 that influenced $180,000 in new opportunities.
Pipeline ROI = [($180,000 – $20,000) / $20,000] x 100 = 800%
Limitations: Needs a reliable attribution model to accurately define “influenced pipeline.”
Incremental ROI (lift analysis)
Incremental ROI measures the lift or improvement a marketing activity creates over a baseline. This is especially useful in A/B tests, geo-split campaigns, or channel experiments.
- Incremental ROI = [(Revenue from Test Group – Revenue from Control Group) / Marketing Investment] x 100
Key metrics included:
- Test Revenue. Revenue generated with the marketing intervention.
- Control Revenue. Revenue generated without it.
- Marketing Cost. Cost of the specific test activity.
Example:
An email personalization experiment cost $8,000. The personalized group generated $50,000, while the control group generated $30,000.
Incremental ROI = [($50,000 – $30,000) / $8,000] x 100 = 250%
Limitations: Requires a properly isolated experiment or control group. Not always scalable across every campaign.
Attribution modeling
As discussed before, this approach assigns ROI based on multiple touchpoints across the buyer’s journey, rather than giving credit to just the first or last touch.
It divides credit across interactions (emails, ads, webinars, etc.) and ties them to final revenue or pipeline.
Also note, there’s no ‘single’ formula for calculating attribution—it all depends on the model (linear, time decay, U-shaped, etc.).
But in essence a baseline calculation:
- ROI per Touchpoint = (Revenue Influenced by Touchpoint / Cost of Touchpoint) x 100
Key metrics included:
- Touchpoint Cost. The spend on each engagement (e.g., webinar platform, paid ad, nurture email).
- Touchpoint Influence. How much each touch contributed to revenue or pipeline.
Example:
A $10K webinar that touched 5 opportunities which closed at a combined $100,000.
If we’re to use a time decay logic, the model assigns 20% of credit to the webinar
Revenue Attributed = $20,000
ROI = [($20,000 – $10,000) / $10,000] x 100 = 100%
Limitations: Requires a robust attribution system and clean data. Can get messy without alignment across teams.
How to choose the right ROI calculation method
There’s no general formula that works for every team or campaign. The best method depends on your goals, your sales cycle complexity, and the tools you have at your disposal.
If you’re just getting started, keep it simple—begin with classic ROI or ROAS for quick insights.
As your tech stack matures and your attribution improves, move toward multi-touch or pipeline-based models that reflect the true complexity of modern B2B journeys.
DB Nuggets → Even when direct ROI is hard to calculate, you should estimate expected value by blending attribution models, historical conversion rates, and funnel metrics.
Curious about your ROI?
What is considered a good marketing ROI?
In most industries, a 5:1 ratio (or 500% ROI) is considered strong. This means for every $1 spent on marketing, you generate $5 in revenue.
We also have:
- 2:1 ratio (200%) — which is typically considered break-even to moderate. It’s a positive ROI, but might not be enough to truly drive growth.
- 10:1 ratio (1000%) — which is seen as exceptional, but often unrealistic or unsustainable at scale.
But here’s the catch: this doesn’t account for cost of goods sold (COGS), customer success, overhead, or operational costs. That’s why ROI should also be compared to margins and customer acquisition costs, not just revenue.
Factors that define a “good” ROI
Your industry or business model
Different industries have different cost structures, deal sizes, and customer values.
| Industry | Common ROI Range | Notes |
|---|---|---|
| B2C eCommerce | 2:1 to 4:1 | Lower margins and faster sales cycles. ROI targets are conservative but volume is high. |
| SaaS (PLG or SMB) | 3:1 to 6:1 | Subscription value accumulates over time. LTV matters more than immediate ROI. |
| B2B SaaS / Enterprise | 5:1 to 10:1+ | Long sales cycles and large deal sizes mean higher ROI expectations. But measurement is harder. |
| DTC Consumer Goods | 2:1 to 5:1 | Influencer and content-heavy strategies mean ROI can fluctuate by channel. |
| Professional Services | 3:1 to 7:1 | High-margin services usually deliver solid returns, but ROI may be slower to materialize. |
Sales cycle length and LTV
A good ROI is closely tied to how long it takes to close a customer, and how much value that customer brings over time.
Short Sales Cycle (e.g., <$100 product):
- ROI is often measured in days or weeks.
- Break-even quickly is key.
- “Good” ROI might be 2:1 with high transaction volume.
Long Sales Cycle (e.g., B2B SaaS):
- Revenue may be delayed by 30–180 days.
- LTV is the better indicator of return, not just immediate revenue.
- Even a 1.5:1 ROI at acquisition can become 5:1+ over a 12-month LTV window.
Marketing channels
Different marketing channels have different ROI profiles, driven by cost, targeting accuracy, and customer intent.
| Channel | Typical ROI Behavior |
|---|---|
| Paid Search (Google Ads) | High-intent, high ROI if targeted well. Often 4:1 to 8:1. But can be expensive to maintain long term |
| Paid Social (Meta, LinkedIn) | Can be hit or miss. Good for retargeting and TOFU. ROI ranges widely (2:1 to 6:1). |
| Email Marketing | Low cost, high ROI. Industry average claims $36 for every $1 spent, though this varies. |
| Content Marketing (SEO) | Slow to build, but high ROI over time due to compounding organic traffic. |
| Influencer Marketing | Depends heavily on audience fit and creativity. Can be exceptional or poor. |
| ABM Campaigns | High cost but high value per conversion. Often shows ROI over a longer period. |
Campaign type and intent
Not all campaigns are meant to generate immediate revenue. Some are designed for awareness, engagement, education, or long-term nurturing.
Direct Response Campaigns
- Goal. Immediate sales or leads.
- ROI is easier to measure.
- Benchmarks. 3:1 to 5:1 or higher expected.
Brand Awareness Campaigns
- Goal. Visibility, mindshare, top-of-funnel engagement.
- ROI may be low in short-term revenue.
- Value shows up later in lower CAC, faster conversions, or increased branded search.
Lead Nurturing Campaigns
- Goal. Move prospects down the funnel.
- ROI grows over time as nurtured leads convert.
DB Nuggets → What’s “Good” Depends on Your Marketing Strategy
A “good” marketing ROI is not always the highest number—it’s the smartest return for your current goals, budget, and growth stage.
- For growth-stage startups: breaking even fast and building long-term LTV might be good enough.
- For mature companies: you might optimize for 5:1+ with strong CAC:LTV ratios.
- For strategic initiatives (brand, expansion, product launch): ROI might take a back seat to reach, sentiment, or market validation.
The key is not to chase inflated numbers, but to understand what level of ROI supports sustainable sales growth, aligns with your business model, and validates your marketing investment.
Additional metrics that influence marketing ROI
While ROI is a crucial metric, it’s most effective when considered alongside other metrics and or Key Performance Indicators (KPIs).
These additional metrics provide a more nuanced understanding of marketing performance and help explain why ROI is what it is.
Return on ad spend (ROAS)
This measures the revenue generated for every dollar spent on advertising.
- ROAS = Revenue from Ad Campaign / Cost of Ad Campaign
Example:
If a company spends $10,000 on a Google Ads campaign and generates $50,000 in revenue:
ROAS = $50,000 / $10,000 = 5
This indicates a return of $5 for every $1 spent.
Customer acquisition cost (CAC)
This represents the average expense to acquire a new customer, including marketing and sales costs.
- CAC = Total Sales and Marketing Expenses / Number of New Customers Acquired
Example:
If a company spends $200,000 on sales and marketing in a quarter and acquires 1,000 new customers:
CAC = $200,000 / 1,000 = $200
This means it costs $200 to acquire each new customer.
Customer lifetime value (CLTV or LTV)
CLV estimates the total revenue a business can expect from a single customer account throughout their relationship.
- CLV = Average Purchase Value x Purchase Frequency x Average Customer Lifespan
Example:
If customers typically spend $50 per purchase, make 5 purchases per year, and remain customers for 3 years:
CLV = $50 x 5 x 3 = $750
This indicates each customer is worth $750 over their lifetime.
Cost per lead (CPL)
This measures the cost effectiveness of marketing campaigns in generating new leads.
CPL = Total Marketing Spend / Total Number of Leads Generated
Example:
If a company spends $5,000 on a campaign that generates 250 leads
CPL = $5,000 / 250 = $20
This means each lead costs $20 to acquire.
Click-through rate (CTR)
This measures the effectiveness of a campaign’s call-to-action by showing what percentage of viewers clicked through after seeing an ad, link, or email.
CTR (%) = (Number of Clicks / Number of Impressions) x 100
Example:
If your email was delivered to 10,000 people and received 400 clicks:
CTR = (400 / 10,000) x 100 = 4%
Recommended → How to ABM Like a Boss (Part 6): Measure with Account-Based Marketing Metrics
Best practices for measuring marketing ROI
- Align ROI Measurement With Business Goals
- Track and Centralize All Marketing Data
- Choose the Right Attribution Model for Your Sales Cycle
- Include All Relevant Costs (Not Just Ad Spend)
- Monitor ROI Over the Right Timeframe
- Tie ROI Back to Customer Lifetime Value (LTV)
- Establish Consistent Reporting and Benchmarks
Align ROI measurement with business goals
Measuring ROI in isolation (just revenue vs. spend) ignores the purpose behind your campaign.
ROI must be tied to the intent of your marketing plan—whether that’s driving revenue, generating leads, improving retention, or building brand equity.
How to do it:
- Assign specific KPIs aligned to the campaign type (e.g., Revenue for BOFU, MQLs for MOFU, Brand Lift for TOFU).
- Set ROI thresholds depending on the goal. For example:
- Lead-gen campaign: $50 CPL with $500 average deal value might be a win.
- eCommerce: 3:1 ROAS minimum based on margin structure.
“One of the first indicators of successful sales and marketing strategy is the alignment of critical metrics that matter to the business. When I was an analyst at TOPO and Gartner, we observed this single factor — documented and shared measures of success often separate top performers from everyone else.”

Head of GTM & Thought Leadership, Demandbase
Track and centralize all marketing data
ROI is a data-driven metric, and fragmented data = unreliable ROI.
Most businesses have campaign data scattered across Google Ads, Facebook, CRMs, email tools, and spreadsheets. Without integration, you’ll miss key costs, touchpoints, or conversions.
How to do it:
- Integrate your tools into a central dashboard or reporting platform (like Looker, Power BI, or HubSpot dashboards).
- Use UTM parameters consistently to tag every campaign.
- Ensure your CRM (e.g., Salesforce or HubSpot) tracks marketing sources and ties leads/opportunities back to campaigns.
Choose the right attribution model for your sales cycle
Attribution determines who gets credit for the conversion. Using the wrong model skews ROI, either inflating top-funnel or bottom-funnel contributions and leading to poor optimization decisions.
How to do it:
- Match your attribution model to your customer journey:
- Short sales cycle (DTC/eCom): Last-click or position-based may work well.
- Long sales cycle (B2B SaaS): Use linear or time-decay to reflect nurturing paths.
- Complex, high-touch journeys: Use data-driven attribution if volume allows.
- Tools like Demandbase, support multiple attribution views.
Include all relevant costs (not just ad spend)
Many ROI calculations are overly optimistic because they exclude costs like team time, creative production, or marketing tools. This leads to inflated ROI metrics that misguide investment decisions.
How to do it:
- Create a marketing cost allocation framework, including:
- Direct costs (media, tools)
- Indirect costs (salaries, production)
- Use time-tracking tools like Toggl, or estimation templates to assess team contributions.
- Add cost fields to your campaign tracking sheets and connect them to your ROI reports.
Monitor ROI over the right timeframe
ROI matures over time. If you measure it too early, especially in long sales cycles or lead-gen campaigns, you’ll undervalue your efforts.
How to do it:
- Define the conversion window based on your average sales cycle.
- e.g., For a 90-day sales cycle, track ROI over 90+ days—not just 14.
- Use rolling ROI metrics: Track 30/60/90-day returns to see performance over time.
- For long-term campaigns (like SEO or brand), supplement with proxy metrics until revenue hits.
Tie ROI back to customer lifetime value (LTV)
Not all customers are equal. Some will bring long-term value beyond their initial purchase—especially in SaaS, subscription, or repeat-purchase businesses. ROI based on one-time revenue ignores the full impact of marketing.
How to do it:
- Calculate average LTV per customer segment using CRM or retention analytics.
- Use LTV instead of one-time sale revenue in your ROI formula:
- LTV ROI = [Customer LTV — Cost to Acquire / Cost to Acquire ] x 100
- Segment LTV by channel or campaign to see which efforts bring your most valuable customers.
- Create campaign dashboards that layer ROI with 3–5 additional KPIs.
- Include funnel conversion breakdowns (click → lead → MQL → SQL → revenue).
Recommended → The Undeniable Impact of Account Tiering for a Modern ABM Strategy
Establish consistent reporting and benchmarks
One-off ROI reports are interesting. But trend data is powerful. By tracking ROI across time, campaigns, and channels, you can build benchmarks that inform budget planning, hiring, and forecasting.
How to do it:
- Build a monthly ROI dashboard that includes:
- ROI by campaign
- ROI by channel
- ROI vs target
- ROI trends over time
- Use campaign tags and UTM parameters to group similar campaign types for comparison.
- Establish baseline ROI ranges (e.g., average ROI for paid search, email, webinars) and update them quarterly.
- Use heat maps or scorecards to track campaign health across metrics.
Challenges of measuring marketing ROI (and how to solve them)
Fragmented data across the system
One of the most fundamental blockers to accurate ROI tracking is data fragmentation.
Marketing, sales, advertising, and web analytics often operate in silos—each with their own systems, tagging conventions, and reporting dashboards.
CRM data may tell one story, your ad platform tells another, and web analytics tells something else entirely.
Without a unified view of the customer and their full journey, it becomes incredibly difficult to tie specific marketing actions to pipeline outcomes. You end up with incomplete, duplicate, or conflicting data, which makes reliable ROI attribution almost impossible.
What this leads to:
- Inaccurate reporting
- Lost or duplicated conversions
- Misaligned revenue attribution
- Budget decisions based on flawed insights
Solution: Create a cross-functional data governance framework
Align marketing, sales, and analytics teams to define shared data definitions, e.g., what qualifies as a lead source, campaign, or conversion event.
Document these in a central playbook and enforce them via naming conventions, tagging standards, and platform automation (e.g., validation rules in your CRM).
Long and complex B2B buying cycles
In B2B, deals often take 6-12 months to close. Multiple stakeholders are involved. Engagements happen through ads, email, events, social, website, and direct sales touchpoints.
By the time a deal is won, it’s nearly impossible to say which campaign, channel, or piece of content truly “caused” the conversion.
This complexity makes traditional last-touch or first-touch attribution models feel shallow. Without a multi-touch, account-based view of influence, marketers are forced to oversimplify complex journeys and make decisions based on surface-level interactions.
What this leads to:
- Under-attribution to early-stage campaigns (e.g. awareness)
- Over-attribution to late-stage assets (e.g. pricing page visits)
- Misjudged campaign effectiveness
- Disconnect between brand investment and revenue results
Solution: Extend attribution windows to match your average sales cycle
If your sales cycle averages 90 days, use at least a 90–120-day attribution window.
This ensures early-stage engagements (e.g., webinars, whitepapers) are captured and credited properly, even if revenue occurs much later.
Inconsistent attribution models
Most teams use some form of attribution to connect marketing actions to revenue—but the model itself often introduces bias or blind spots.
First-touch gives too much credit to top-of-funnel, while last-touch ignores the nurturing journey. Even multi-touch models can vary in logic (linear vs. time decay vs. U-shaped), and each produces a different ROI picture.
The challenge isn’t really about picking a model. It’s more on maintaining consistency across channels, teams, and reports. Different tools apply attribution differently, and internal stakeholders often debate which numbers are “real.”
What this leads to:
- Confusion across teams
- Mistrust in reported ROI metrics
- Misaligned success criteria
- Difficulty scaling proven plays
Solution: Run periodic attribution model comparisons to calibrate accuracy
Use tools that allow side-by-side attribution model comparisons (e.g., linear vs. first-touch vs. data-driven).
Compare ROI outputs and validate assumptions quarterly. This helps you fine-tune your model or move toward hybrid/custom logic as needed.
Lack of visibility into anonymous and indirect engagement
Not all marketing efforts are designed for immediate revenue. Brand awareness, customer education, SEO, and community building drive long-term value but don’t always have direct financial attribution.
For example, a key decision maker might have browsed your site, consumed ungated content, and talked internally long before they’re known to your systems.
Meanwhile, because you’re not capturing that behavior, then ROI for that type of engagement will look low.
What this leads to:
- Skewed perception of which channels “work”
- Slower response to buying signals
- Missed opportunities to accelerate pipeline
Solution: Develop proxy metrics and blended ROI models
- For brand campaigns: use engagement rates, share of voice, or branded search lift.
- For SEO: track traffic growth, rankings, assisted conversions.
- For community and thought leadership: measure influence scores, social amplification, or survey-based brand lift.
Manual effort and resource constraints
Even when the data exists, many teams simply don’t have the time, tools, or resources to build, clean, and maintain an ROI tracking system.
Manually stitching together campaign data, CRM reports, attribution logs, and pipeline stages becomes unsustainable as programs scale.
This results in delayed reporting, outdated dashboards, or worse—abandoning ROI tracking altogether in favor of short-term metrics.
What this leads to:
- Burnout among ops and analytics teams
- Stale data and lagging insights
- Inability to act on findings
- Loss of momentum across GTM teams
Solution: Start with a minimum viable ROI framework
Begin by defining one or two core ROI metrics (e.g., ROAS for paid, influenced pipeline for B2B) and build dashboards only for those.
Prioritize the top 3 revenue-generating campaigns to measure first. Scale the system once accuracy and workflows are established.
Tools and software for tracking marketing ROI
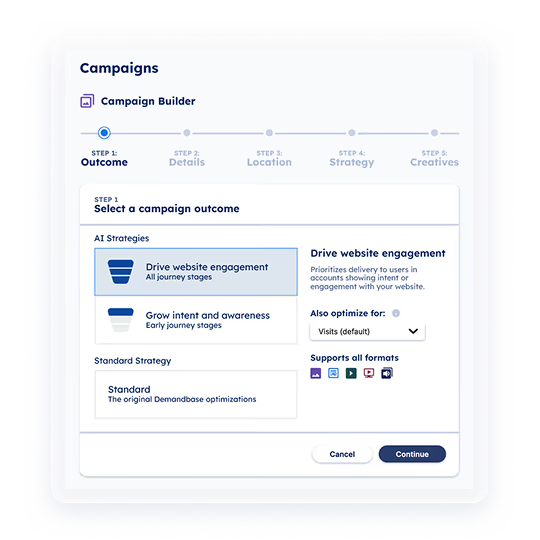
1. Account-based marketing (ABM) platforms
ABM solutions are specifically designed for targeted, high-value marketing efforts focused on accounts rather than individual leads.
These tools help you plan, execute, and measure personalized campaigns across multiple channels to a curated list of companies.
They’re particularly ideal for B2B companies running complex campaigns with high-ticket deals.
Key Features:
- Account-level attribution. Helps identify which campaigns influenced which accounts and when.
- Engagement scoring. Quantifies how engaged each account is across ads, email, web visits, and events.
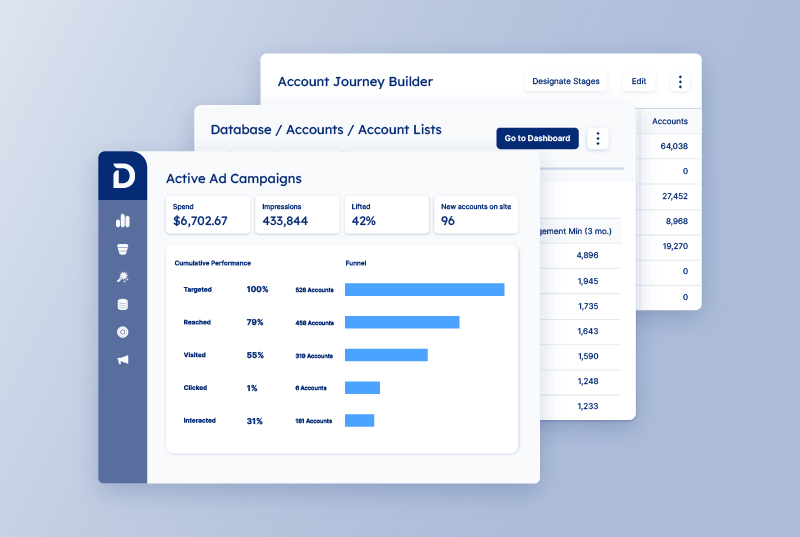
- Pipeline attribution. Maps marketing activities to pipeline stages and revenue, showing ROI based on influence, acceleration, and sourcing.
- Segmentation-based ROI. Measures ROI by industry, buyer persona, or account tier (e.g., ROI from Tier 1 accounts vs. Tier 3).
Examples: Demandbase
- Offers multi-touch attribution, AI-powered intent data, and account journey analytics.
- Directly integrates with Salesforce, Marketo, and other key tools to align revenue impact with ABM efforts.
- Provides pipeline prediction based on engagement trends and account fit.
Other solutions include: 6Sense, Terminus.
Recommended → Understanding AI Lead Scoring: Definition, Benefits, and How to Get Started
2. Marketing analytics platforms
Marketing analytics platforms aggregate, visualize, and interpret performance data across all channels (paid, owned, earned, and shared).
They serve as the central hub for marketing KPIs, allowing you to track how individual campaigns, tactics, or content assets contribute to business outcomes.
Unlike attribution tools (which focus on assigning revenue credit), marketing analytics platforms emphasize performance insight, data storytelling, and optimization.
Key Features:
- Multi-source data integration. Pulls in data from CRMs (like Salesforce), ad platforms (like Google Ads), email platforms, website analytics, and more.
- KPI-based reporting. Customizable dashboards that calculate ROI per channel, per campaign, per time period.
- Conversion funnel analytics. Helps understand where conversions happen, how leads move through stages, and where drop-offs occur.
- Spend vs. return tracking. Tracks total investment against sales revenue or lead value over time.
Examples:
Google Analytics 4 (GA4), HockeyStack, Funnel.io, Adobe Analytics, Supermetrics.
Measure account-based metrics that matter like engagement, journey stage movement, ad performance, and more.
Explore Demandbase B2B Account-Based Analytics →
3. Marketing automation platforms (MAPs)
These are platforms that streamline and automate repetitive marketing tasks—such as email campaigns, lead nurturing, segmentation, form tracking, and personalized workflows.
These tools act as the central system of record for all prospect and customer engagement activities. This enables teams to track campaign performance, and tie activities directly to pipeline progression and sales outcomes.
Key Features:
- Lifecycle tracking across touchpoints. Tracks how fast and efficiently leads move through lifecycle stages (MQL → SQL → opportunity), and calculate cost per progression or ROI by stage.
- Closed-loop reporting. Syncs with CRM, allowing you to track leads from first-touch to closed-won deals.
- Revenue contribution by channel or segment. MAPs can report on the performance of different audience segments, content types, or nurture paths.
Examples:
HubSpot marketing hub, Marketo Engage (Adobe), Pardot (now Salesforce Marketing Cloud Account Engagement)
4. Customer relationship management (CRM) systems
CRMs are the source of truth for all customer and sales data. These tools help you manage contacts, track opportunities, log interactions, and record every stage of the sales pipeline.
When integrated with marketing tools, CRMs show which marketing efforts actually influenced revenue and accelerated deals.
Key Features:
- Custom ROI dashboards and reports. CRMs like Salesforce and HubSpot CRM allow you to build custom dashboards showing:
- Campaign ROI
- Cost per customer
- Revenue generated by lead source
- ROI segmented by account type, industry, or region
- Pipeline and opportunity tracking. Tracks how leads from different campaigns move through pipeline stages, how long they take to convert, and their final deal size.
- Campaign influence reporting. When campaigns are tracked within the CRM (via campaign IDs, lead sources, or UTM data), you can report on how much pipeline and revenue each marketing effort influenced.
- Sales cycle tracking. Measures time from lead creation to deal close, and understand how specific campaigns accelerate or delay revenue impact.
Examples:
HubSpot CRM, Salesforce CRM, Zoho CRM, Microsoft Dynamics 365.
5. Attribution modeling platforms
Attribution modeling (or marketing attribution) platforms specialize in assigning credit to the various marketing touchpoints that influence a buyer’s journey.
Unlike single-touch models (e.g., first-click or last-click), attribution platforms are engineered to track and weigh every interaction potential customers have with your brand.
Their key value lies in solving the complexity of multi-touch journeys, especially in B2B or high-ticket B2C, where leads engage with your business across weeks or months before converting.
Key Features:
- Custom attribution paths. Allows marketers to define custom conversion paths, weighting touchpoints differently based on campaign type or buyer journey complexity.
- Channel & campaign influence analytics. Helps you see how much pipeline or revenue was influenced by specific ads, content, events, or web interactions across a set attribution window.
- Customer journey visualization. Maps out the complete buyer journey across stages, highlighting which sequences or paths deliver the highest ROI.
Examples:
Dreamdata, Bizible (by Adobe), Hockeystack, Windsor.ai.
6. Social media analytics tools
These tools track, measure, and analyze the performance of marketing efforts across platforms like LinkedIn, Twitter/X, Facebook, Instagram, YouTube, and TikTok.
While primarily used for engagement metrics (likes, shares, comments), they also help map how social interactions lead to site visits, signups, MQLs, or revenue using UTM tagging, and pixel tracking.
Key Features:
- Cross-channel performance dashboards. Compares ROI across organic and paid social campaigns by platform, audience, content type, or goal.
- Influencer ROI measurement. For influencer or creator campaigns, many tools assign monetary value to reach and engagement, while others integrate directly with eCommerce platforms to measure conversions and sales.
- Ad spend vs. return tracking. Tracks spend across platforms (Meta, LinkedIn, TikTok, etc.) and aligns it with click-through rates, conversion rates, and attributed revenue.
Examples:
Sprout Social, Hootsuite (with Hootsuite Impact), Socialbakers (now part of Emplifi).
7. Ad performance platforms
Ad performance platforms are the native analytics dashboards within advertising networks—Google Ads, LinkedIn Ads, Meta Ads, X (Twitter) Ads, etc.
These platforms provide real-time performance data on paid media campaigns, allowing marketers to measure reach, engagement, clicks, conversions, —and in some cases, revenue.
Key Features:
- Conversion tracking. Measures form submissions, purchases, signups, or any goal completions directly tied to ad clicks or impressions.
- Cost vs. value reporting (ROAS). Calculates return on ad spend by comparing revenue generated vs. ad budget.
- Audience & placement breakdown. Understands which audience segments, creatives, or placements drive the highest engagement or conversions.
- Real-time budget optimization. Adjusts spend based on live performance metrics (CTR, CPC, CPL, CPA).
Examples:
Google Ads Manager, Meta Ads Manager (Facebook/Instagram), LinkedIn Campaign Manager.
Thinking of how to reach and engage the right people, in the right accounts, when they’re ready to buy – without any wasted spend?
Choose Demandbase as your Ad-tech Partner →
8. Marketing dashboards and reporting tools
These tools aggregate marketing data from various sources and create visualizations and reports, making it easier to track KPIs and demonstrate marketing ROI to stakeholders.
Key Features:
- Custom ROI metrics & KPIs. Allows you to set up custom formulas for CAC, ROAS, CLTV, pipeline velocity, influenced revenue, and more—tailored to your business model.
- Real-time monitoring. Tracks performance daily, weekly, or monthly, enabling teams to pivot quickly if ROI trends are declining or if certain campaigns are overspending.
- Automated stakeholder reporting. Generates presentation-ready dashboards and reports for executives, sales teams, or investors.
Examples:
Tableau (by Salesforce), Power BI (by Microsoft), Google Looker Studio (formerly Data Studio), Databox
You can’t improve what you don’t measure—now you can with Demandbase
If you’ve made it this far, you already get it: measuring marketing ROI is all about proving that your work moves the needle.
But that’s almost impossible because the systems to measure it are broken, fragmented, or not built for how modern marketing actually works.
- Data’s stuck in silos.
- Attribution is all over the place.
And by the time someone asks for ROI, it’s too late—or worse… scrambling to answer.
We don’t want that — and neither do you. So we built Demandbase as an all-in-one account-based go-to-market platform.
Instead of forcing you to hack together metrics from a dozen disconnected tools, Demandbase brings everything (data, attribution, insights, etc.) into one unified revenue engine.
- Real-time ROI insights across channels. Whether you’re running ads, webinars, content syndication, or outbound plays, Demandbase gives you real-time visibility into ROI by channel, campaign, and account segment
- Tie campaigns to pipeline and revenue. With Demandbase, you can connect every campaign to pipeline influence, deal acceleration, and closed-won revenue—helping you prove what’s working and double down on what’s not.
- Multi-touch attribution built for B2B. No more relying on simplistic first- or last-touch models. Demandbase applies account-based, multi-touch attribution that reflects the real B2B buying journey.
It’s why our friends at OneStream chose Demandbase:
Related content


We have updated our Privacy Notice. Please click here for details.