In B2B and B2C sales and marketing, regression analysis is used as a statistical technique to predict a given outcome, to act on in a proactive manner in the interest of the business. Here are two primary examples:
- Predict and target only those customers that will be most interested in learning about, or buying a specific product or service. This helps save the business money and time focusing only on relevant targets.
- Predict existing customers most likely to churn; then target those customers worth saving with special incentives to stay with the business. This is a very important use case today given the macro environment and the fact that it costs 5-10x the amount to acquire a new customer than it does to save one.
The output of regression models also provide detailed descriptions/profiles of the target audience, thus providing information that can be used to personalize the message – resulting in better response rates.
Most business analysts are somewhat familiar with Linear Regression. But, it’s Logistic Regression that allows us to compute propensities to buy and churn.
As a primer, let’s revisit Linear Regression and then compare it to Logistic Regression. We’ll use a B2C example at first since all of us can relate. Later, we’ll expand it to B2B.
Linear Regression
Linear Regression fits a straight line to a set of data observations – in this case, predicting Y based on observations of X. Values for Y can vary from negative to positive.
For example, if Y equals the number of Teslas sold, and X equals average household income for a zip code, the relationship found by the above regression tells us we will sell more Teslas in areas with higher household income.
Logistic Regression
Logistic Regression focuses on predicting the likelihood/probability/propensity of selling something – like a Tesla.
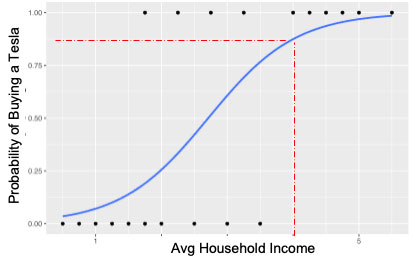
This graph plots customers that have, or have not, purchased Teslas against their Household Income. It then forces a non-linear/S-curve between 0 and 1 since propensities must be within that range.
The horizontal x-axis represents the income of people that have considered purchasing Teslas. The vertical y-axis serves two purposes – first, people that purchased a Tesla are coded as “1’s”; people that considered but didn’t buy Teslas are coded as “0’s”. Second, the propensity of purchasing is also plotted against the Y-axis.
As you can see, the model predicts the probability of buying a Tesla increases for people with higher household incomes. In this hypothetical case, a customer in income Bucket 4 has a 82% probability to buy a Tesla (refer to the dotted red line in the above graph).
We Want All The Data!
Regressions and Machine Learning (ML) can be used to create models that predict propensity. They can also use more than one predictive variable to predict something, i.e. there can be more than one “X-axis” variable. Adding additional important variables/features, increases the accuracy of model predictions.
For example, The Probability of Buying a Tesla is influenced by more than household income – the price of the Tesla, marital status, age, etc., can also help better our propensity predictions.
Now let’s turn to a good B2B example. Most companies will want to determine the probability of an account making it into a company’s official sales pipeline (helps you know who to focus on). In this case, we can hypothesize that the Probability Of Becoming a Pipeline Opportunity (Demandbase calls this Pipeline Predict) is influenced by customer intent, number of website visits, company size, and technology install-base, etc.).
Data scientists might have some idea which variables/features will help predict who will become a Pipeline Opportunity, e.g., like the ones I’ve used above. But there could be many other, non-obvious variables/features that can also help with that prediction.
That’s why data scientists want to buy “ALL THE DATA” – and let their ML algorithms do the hard work to tell them which variables are important.
It’s almost always the case that the algorithms they use will find other variables/features they wouldn’t have already guessed are important.
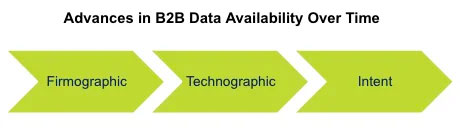
As suggested above, aside from firmographics, newer categories of feature/variable categories are proving useful to data scientists.
Demandbase has worked with companies like Microsoft Azure, DocuSign and Adobe (to name a few) to provide the most extensive set of 3rd-party data available in these categories to support their internal data science efforts.
Technographic:
Does your ideal customer use specific competitive products? Demandbase covers over 18K technologies that may be installed at your prospective customers. We collect information on install-base from behind the firewall (e.g, social profiles, company job postings, etc.) and in front of the firewall (HTML and DNS derived).
Intent:
We process ~20B domain signals per day for over 275K intent keywords. And the number of keywords increases daily as our existing customers add their own specific keywords to the global list. Trending intent is also supported and helps identify a surge in interest in semi-real-time so you don’t miss opportunities.
Additionally Demandbase recently announced the newly launched D2 Labs to deliver tailored account intelligence to customers with limited or no data science capabilities. Customers can now engage with Demandbase’s data experts and data scientists directly to turn their incomplete, inactionable data into revenue-generating insights.
So whether you need more data, or access to data and data science experts, Demandbase is here to help.


We have updated our Privacy Notice. Please click here for details.