
-
Journey Stage
Acquisition
-
Team
RevOps, Sales
-
Expertise Level
Intermediate, Expert
Contents
Partner with Demandbase Experts
Get tailored strategies and insights to optimize your approach, drive engagement, and unlock new opportunities.
What you’ll learn
This playbook is your step-by-step guide to creating effective dashboards and workflows in Salesforce (SFDC). By following these instructions, sales and marketing teams will optimize focus, enhance visibility, and ensure alignment around key sales efforts.
- Advanced Workflow Creation: Develop workflows in SFDC using the Order of Operations to increase focus and efficiency.
- Dashboard Mastery: Build dashboards that enhance visibility for Sales, SDRs, and Sales Management.
- Quarterly Play Integration: Align dashboards with sales and marketing plays to reflect quarterly priorities.
- Optimized Team Focus: Control where your team spends their effort by creating structured, data-driven workflows.
- Accountability Tracking: Use sales touches and “zero-out” lists to ensure responsibility across the sales process.
Why is this important?
Building effective workflows and dashboards in Salesforce is essential for driving alignment, efficiency, and accountability across your sales and marketing teams. Without a clear structure and process, it’s easy for teams to get overwhelmed by data or distracted by low-priority activities. This playbook empowers you to create a streamlined framework that ensures focus on the highest-impact accounts and opportunities.
By following this guide, you’ll gain the tools to integrate actionable insights into your sales efforts, align dashboards with quarterly priorities, and create workflows that keep your pipeline moving. With enhanced visibility into key metrics and progress, sales leaders can make informed decisions, while front-line teams stay laser-focused on what matters most. Use this playbook to build a scalable process, foster accountability, and ensure every action contributes to the success of your sales strategy.
What you need to get started
- SFDC access with rights to customize dashboards and workflows.
- Prescriptive dashboards for foundational understanding.
- Access to Demandbase One for Sales.
- Integration between Salesforce and Demandbase One for Sales.
Step-by-step playbook
Step 1: Creating an Order of Operations workflow in SFDC
An Order of Operations workflow provides a framework for your team to strategically prioritize tasks and accounts using data insights from SFDC and other tools. It empowers your team to focus on the highest-impact activities and ensures alignment between Sales Development Representatives (SDRs), Sales Management, and Marketing.
Why Create an Order of Operations Workflow?
- Focus Areas: Direct your team’s attention to high-value activities and accounts.
- Visibility: Increase transparency for SDRs and Sales Management.
- Sales & Marketing Alignment: Sync workflows with current plays and quarterly goals.
- Ease of Use: Utilize a familiar platform (SFDC) to consolidate critical information.
- Accountability: Leverage data to monitor progress and encourage ownership.
With your workflow in place, you’ll integrate actionable steps like sales touches and “zero-out” lists to keep your pipeline moving efficiently.
SFDC Out of the Box Fields
Standard fields that are part of the SFDC install package
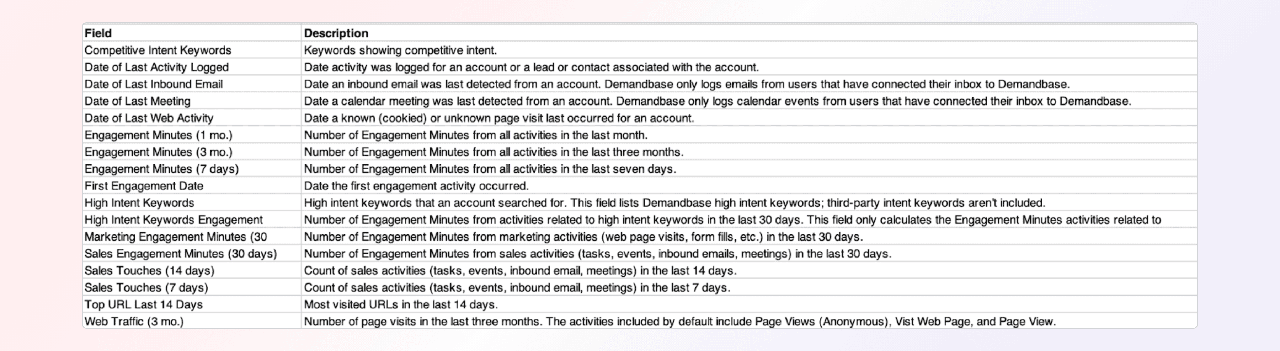
Recommended Custom/Calculated Fields
-
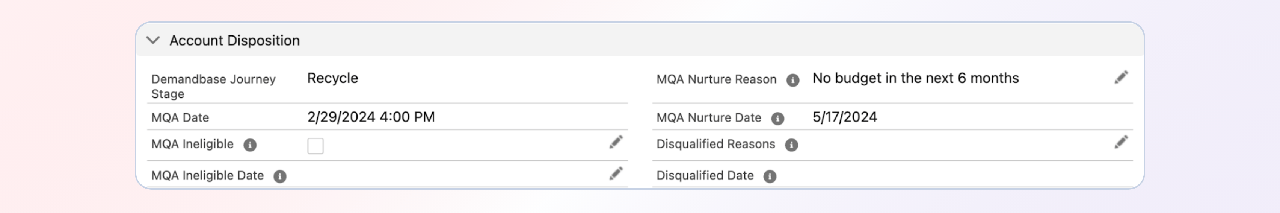
- Journey Stage + Disposition
-
- High-Value Page Visits

-
- Intent by Product/Solution/Industry + Competitive

-
- Sales Touches by Persona

Step 2. Define how you want your team to work
Start by deciding what actions your team should prioritize throughout the sales cycle. Here’s a helpful way to classify key targets and triggers into tiers:
- Act Immediately: Focus on demo/contact requests, email opens/replies, LinkedIn messages, or Slack alerts that indicate interest.
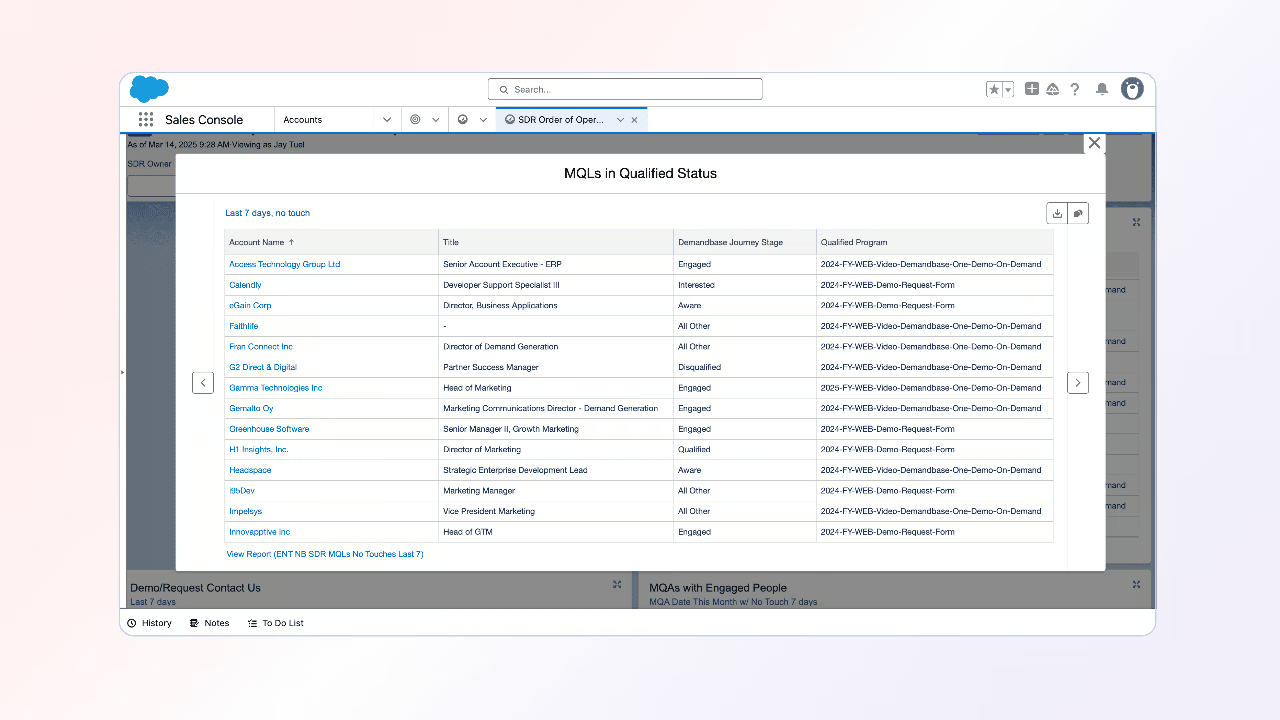
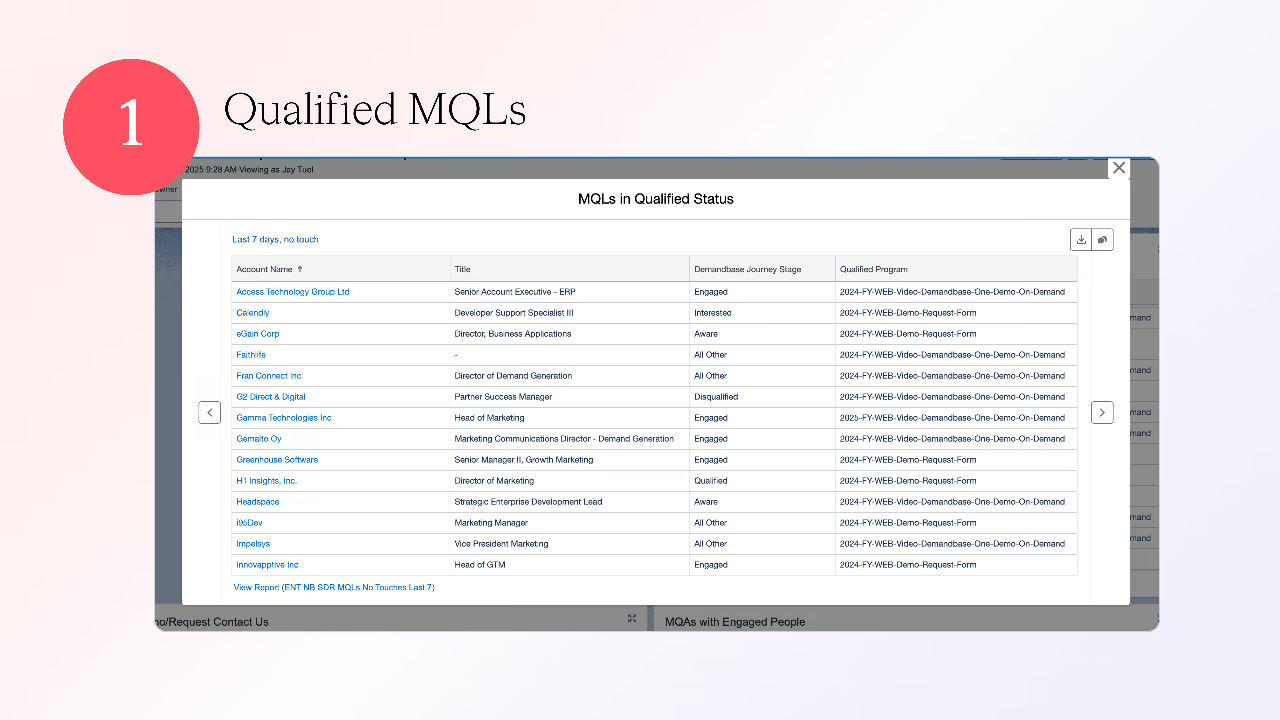
- MQLs (Marketing Qualified Leads): Identify the right personas with high engagement across campaigns, website visits, and sales outreach.
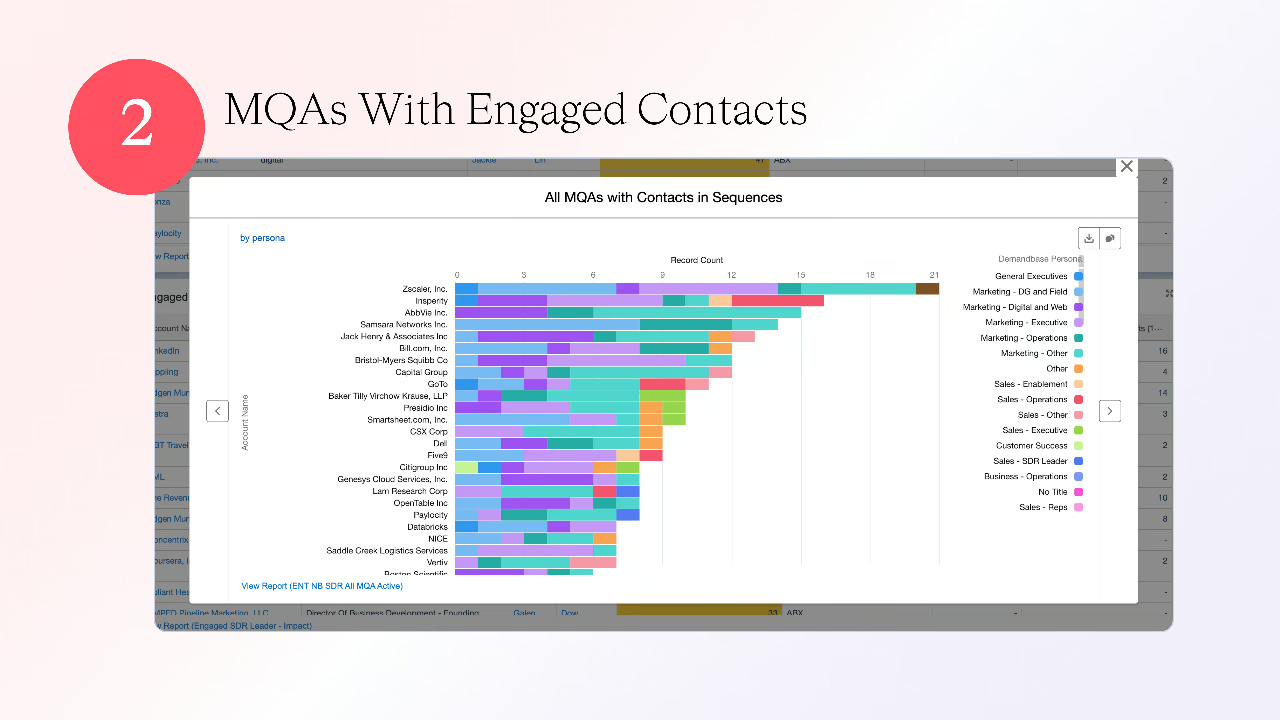
- MQAs (Marketing Qualified Accounts): Track accounts where multiple individuals show high, recent engagement.
- Product/Service Interest: Look for activity that links to product pages, case studies, or other intent-signifying content.
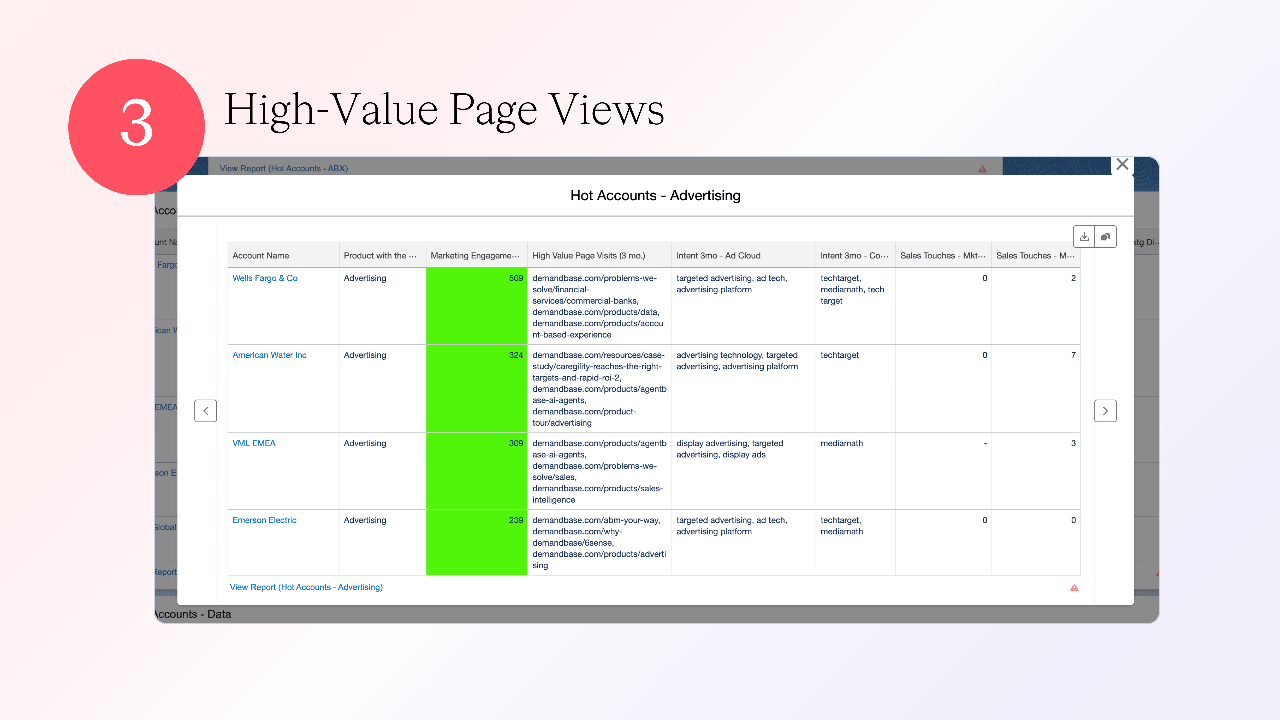
- High-Value Page Views + Intent: Monitor visits to pages like case studies, pricing, and demos.
- Closed/Lost Re-engaged: Opportunities lost over 90 days ago re-entering the engagement cycle.
- Competitive Intel Leads: Accounts demonstrating interest in competitors, renewal dates, or review sites.
- Technographic Data: Prioritize Tier 1 and Tier 2 accounts with specific CRMs, Marketing Automation Systems (MAS), or other Sales Intelligence technologies.
By defining these priorities, your team can quickly identify and act on the most urgent and promising opportunities.
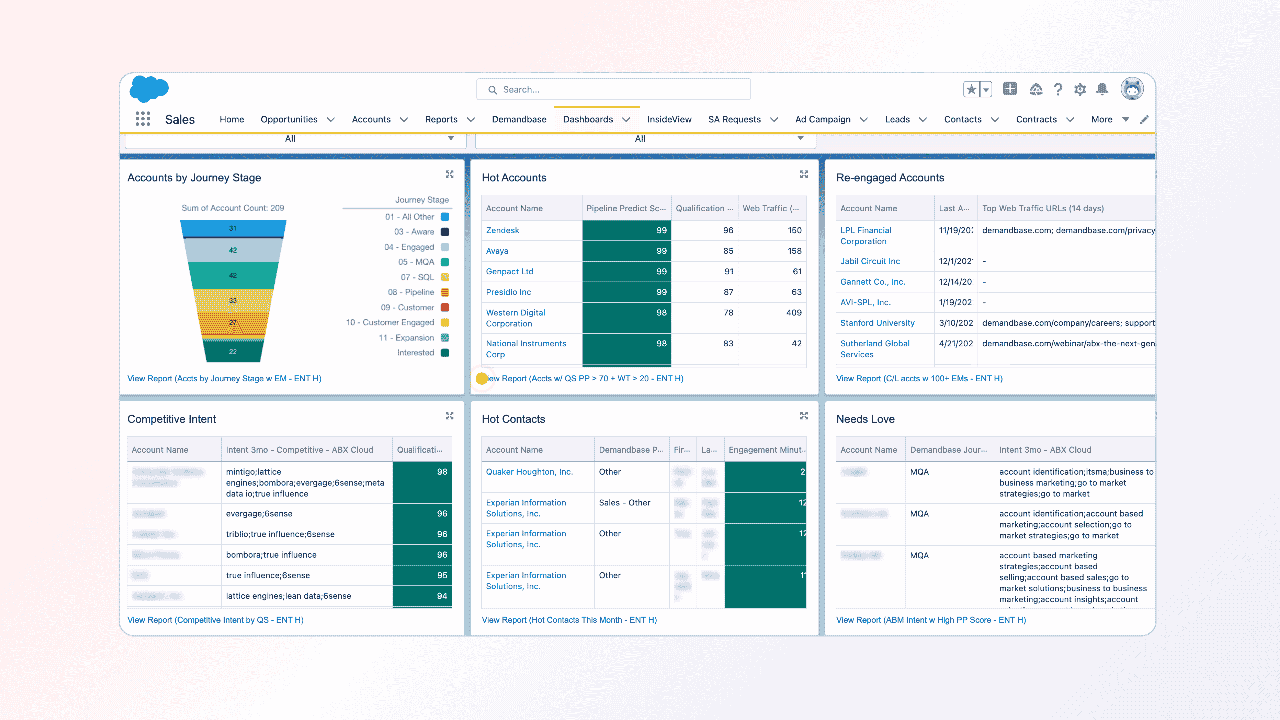
Step 3. Create order of operations dashboard reports
MQA Report
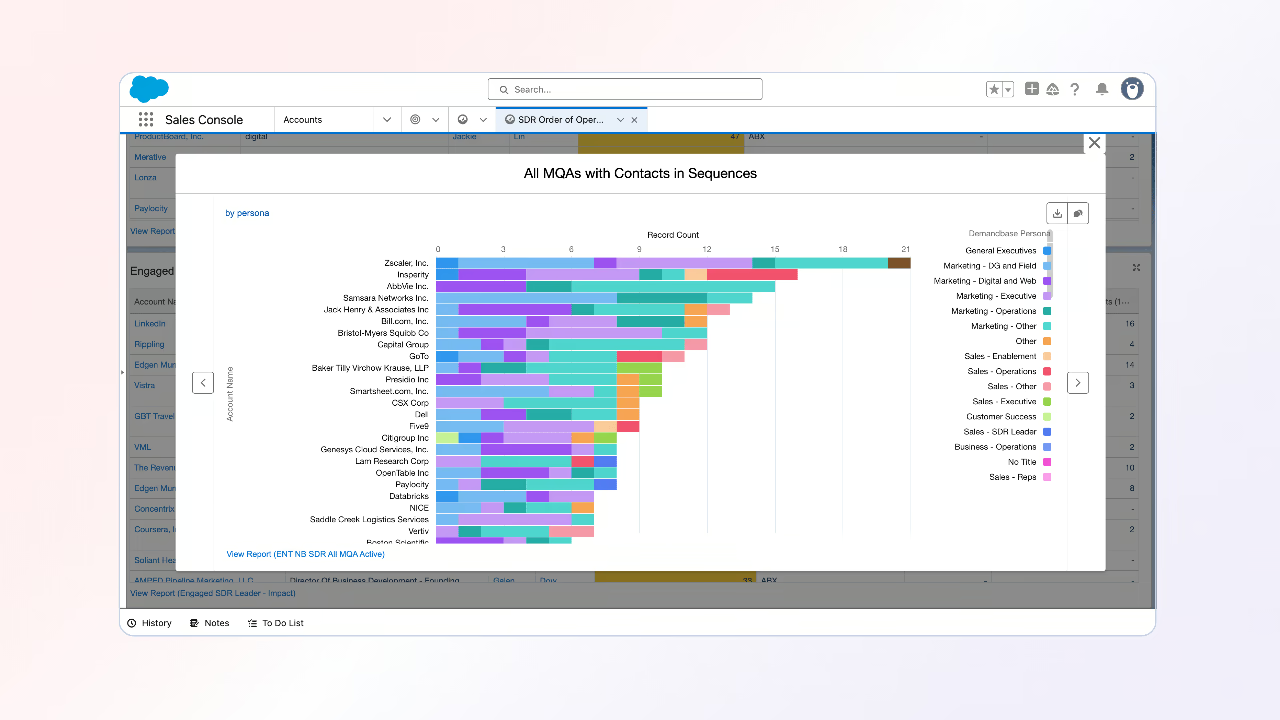
- Purpose: Track the effectiveness of your work with Marketing Qualified Accounts.
- Insights Delivered:
- Understand how prospects are being sequenced in tools like Outreach.
- Analyze multi-threading efforts and recommendations for improved engagement.
Closed/Lost Re-Engaging Report

- Purpose: Surface opportunities that previously failed but are showing renewed interest.
- Filters: Narrow by timing-related closed/lost reasons, product interest, and contact roles.
- Actionable Insight: Match current engagement signals to previously expressed interest, signaling readiness to re-enter the buying process.
Product Page Views + Intent Report
- Purpose: Combine 1st-party engagement data with intent signals for accounts progressing through the funnel.
- Actions to Take: Increase sales touches for these accounts. Use insights to uncover research motivations and personalize outreach.
Competitor/partner Intent & Technographics
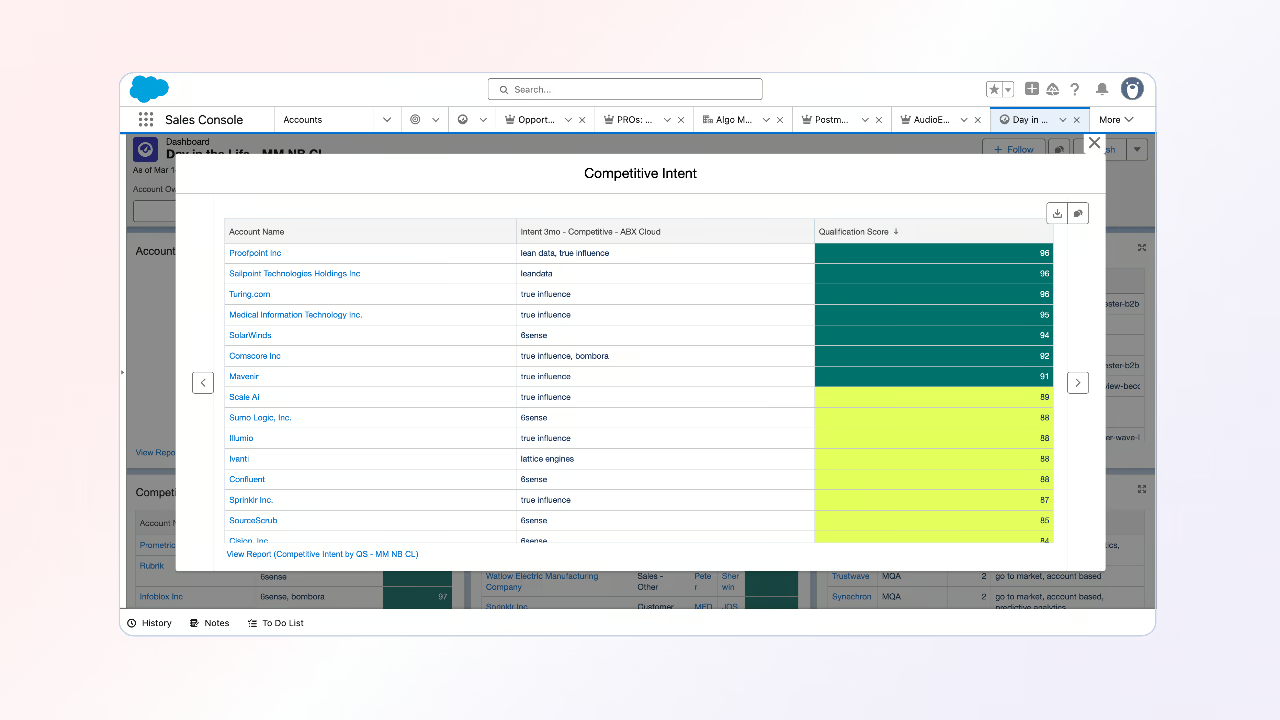
- Purpose: Track accounts with competitive/partner intent or installed technographics that are likely a good fit and sticky with your product.
- Actionable Insight: Historical and competitive intent technographics for scoring accounts and crafting relevant messaging about how you are different from a competitor or complementary with a partner.
Demo or Pricing Page View Report
- Purpose: Uncover “near-opportunity” accounts that visited demo request or pricing pages but did not convert.
- Actionable Insight: Identify additional pages visited and use those insights to tailor outreach messaging.
High-Value Pages Report
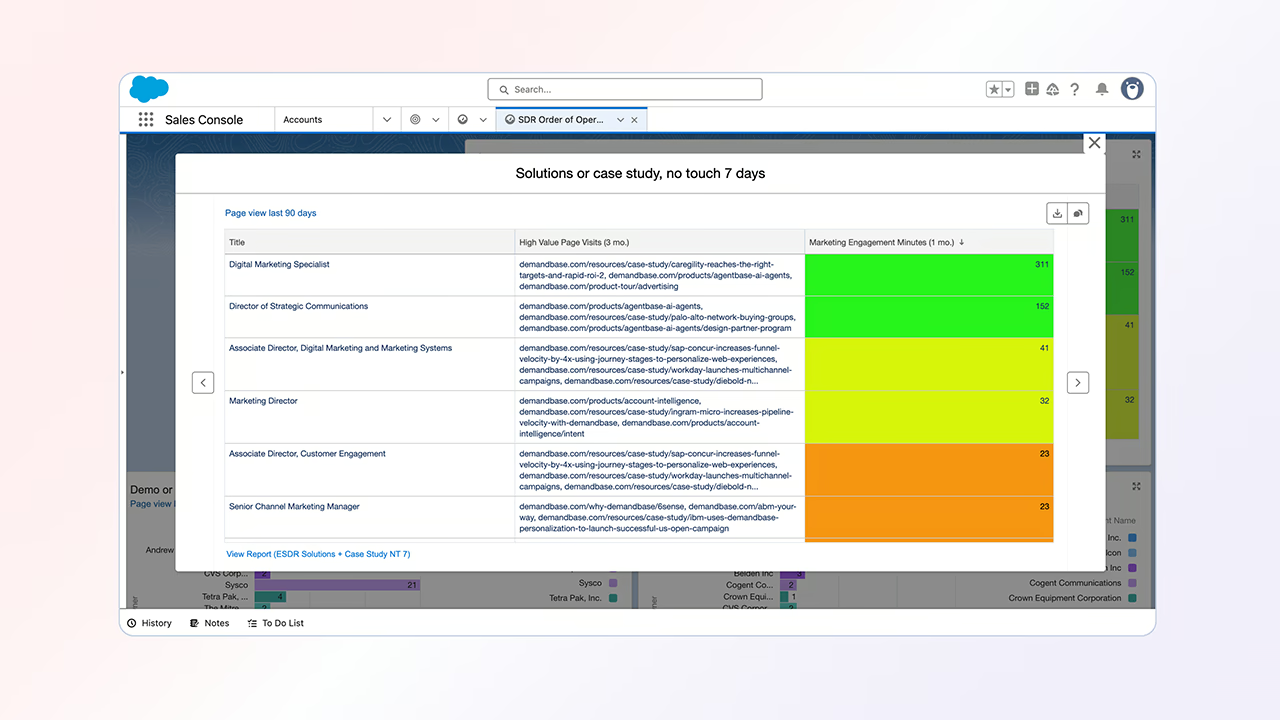
- Purpose: Highlight accounts engaging consistently with high-conversion potential pages (e.g., case studies, whitepapers).
- Implementation Tip: Collaborate with Marketing and Operations to tag high-value pages and create a related custom SFDC field.
- Bonus Points: Hyperlink pages within dashboards to enable quick access during outreach.
Step 4: Build order of operations with sales plays
-
- Qualified and Engaged MQLs Action:
Reach out to the MQLs who have visited the demo or pricing page immediately to gauge their interest.
- Qualified and Engaged MQLs Action:
-
- MQA Actions:
Start with the engaged contacts, and focus the outreach on engagement and why it matters to their role.
- MQA Actions:
-
- High-Value Page Views:
Look at what high-value pages the account was on and check for competitive intent and the activity by person. Create an engaging email outreach to those contacts highlighting the value. For example, if they were on your product/solutions page, showcase how you have helped similar companies in your email messaging.
- High-Value Page Views:
- Training: Train your team to interpret each report, identify key signals, and take appropriate next steps.
- Sales Play Alignment: Teach SDRs and the Sales organization to embed these dashboards into their sales plays for maximum efficiency.
By combining structured dashboard reports with actionable workflows, your sales and marketing teams can confidently pursue high-priority accounts and improve pipeline velocity.
Step 5. Example Sales Manager reports
Sales Management reports are designed to help leaders prioritize team efforts, optimize pipelines, and measure the impact of Account-Based Marketing (ABM). These reports offer a consolidated view of team performance while identifying opportunities to improve.
Report Focus Areas
- ABM Impact: Measure attribution and performance of ABM efforts compared to inbound MQLs.
- Pipeline Distribution: Analyze how Target Account List (TAL) opportunities compare to non-TAL and distribute them across team segments.
- Hot Accounts: Surface priority accounts ranked by engagement, product interest, and persona activity.
- Closed/Lost Re-Engaged Opportunities: Identify former opportunities re-engaging after 90+ days.
- Engaged Personas: Monitor campaign engagement by key target personas and sales touchpoints.
Example Reports
ABM Impact – Target Account Performance
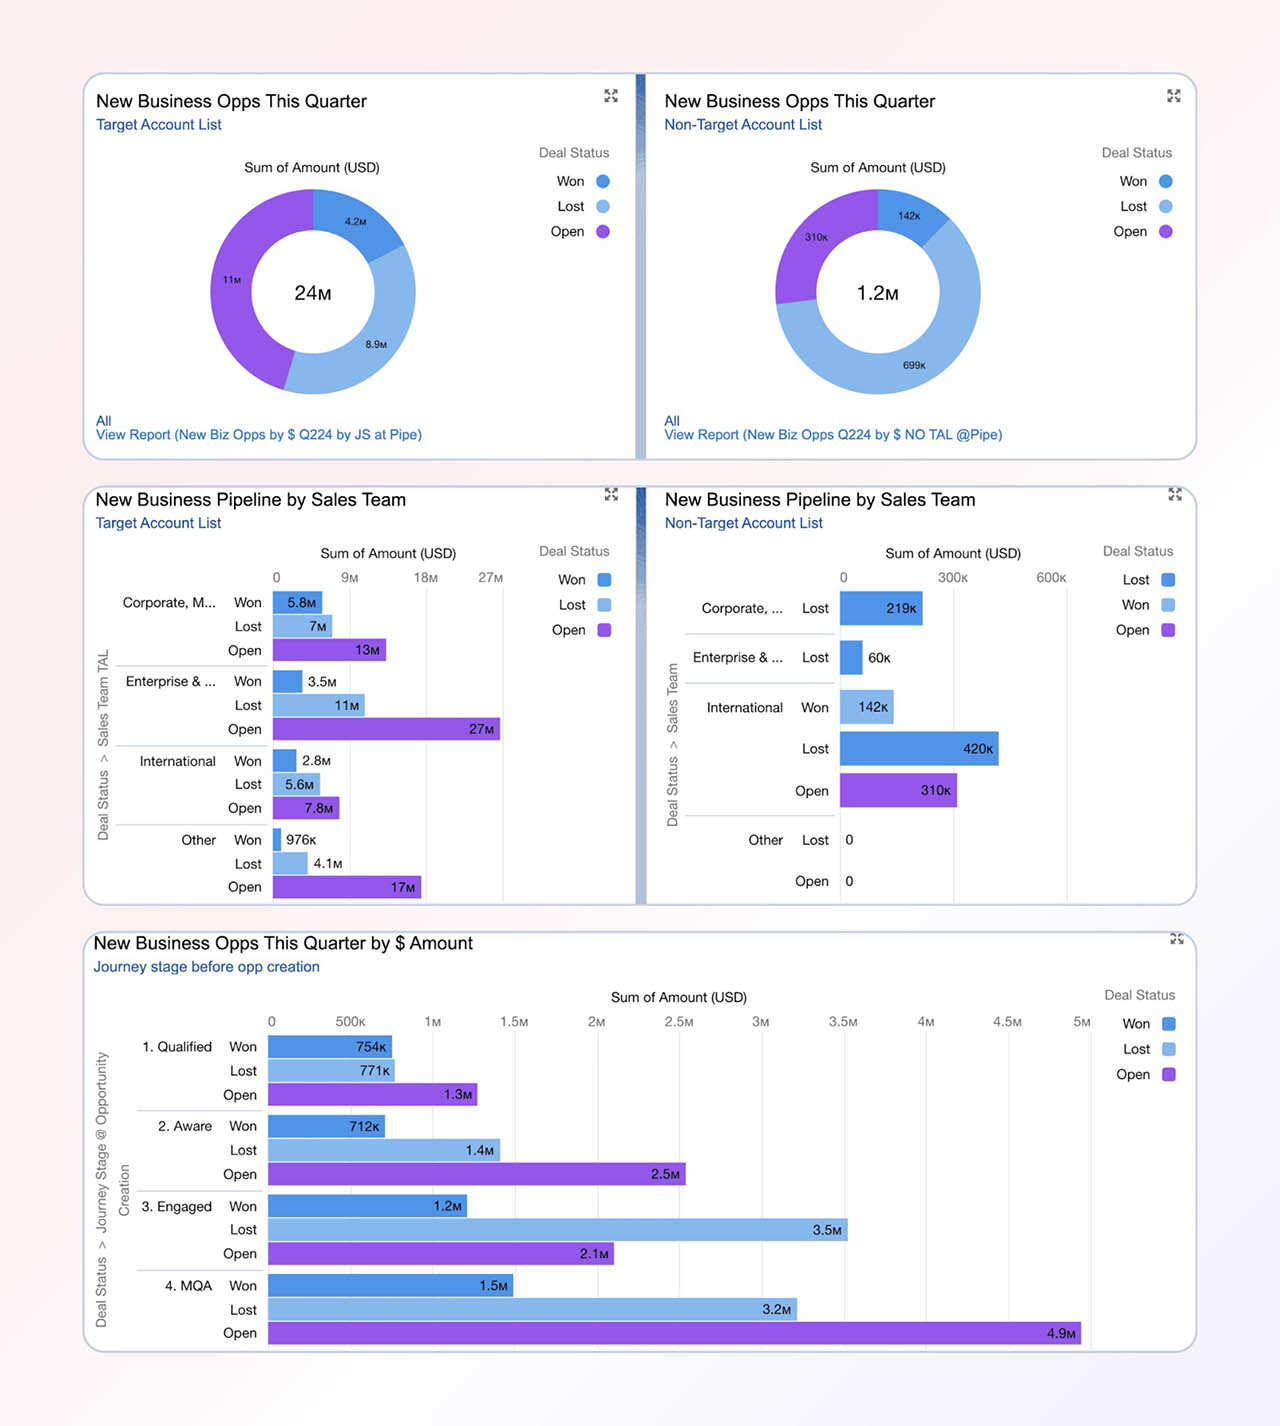
- Purpose: Assess success rates of target accounts versus inbound MQLs.
- Metrics Tracked:
- Opportunity creation stage.
- Wins/losses by creation stage (quarterly/YTD).
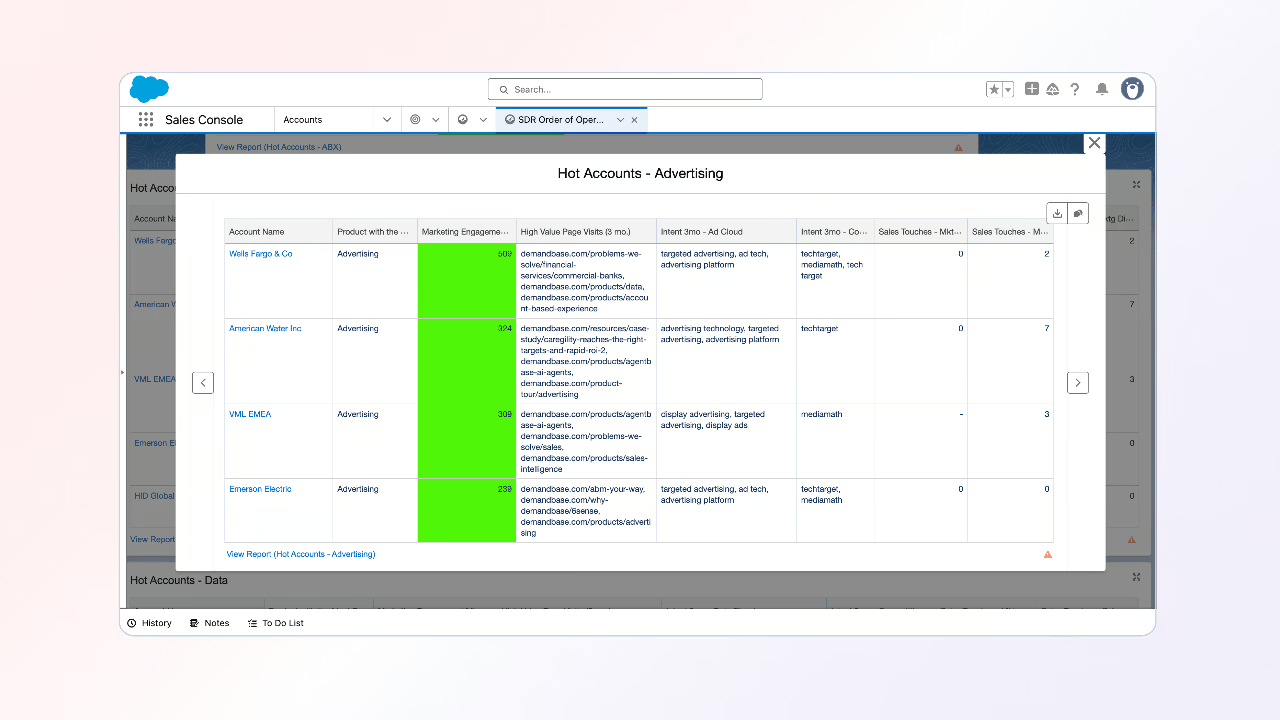
ABM Impact – Hot Accounts
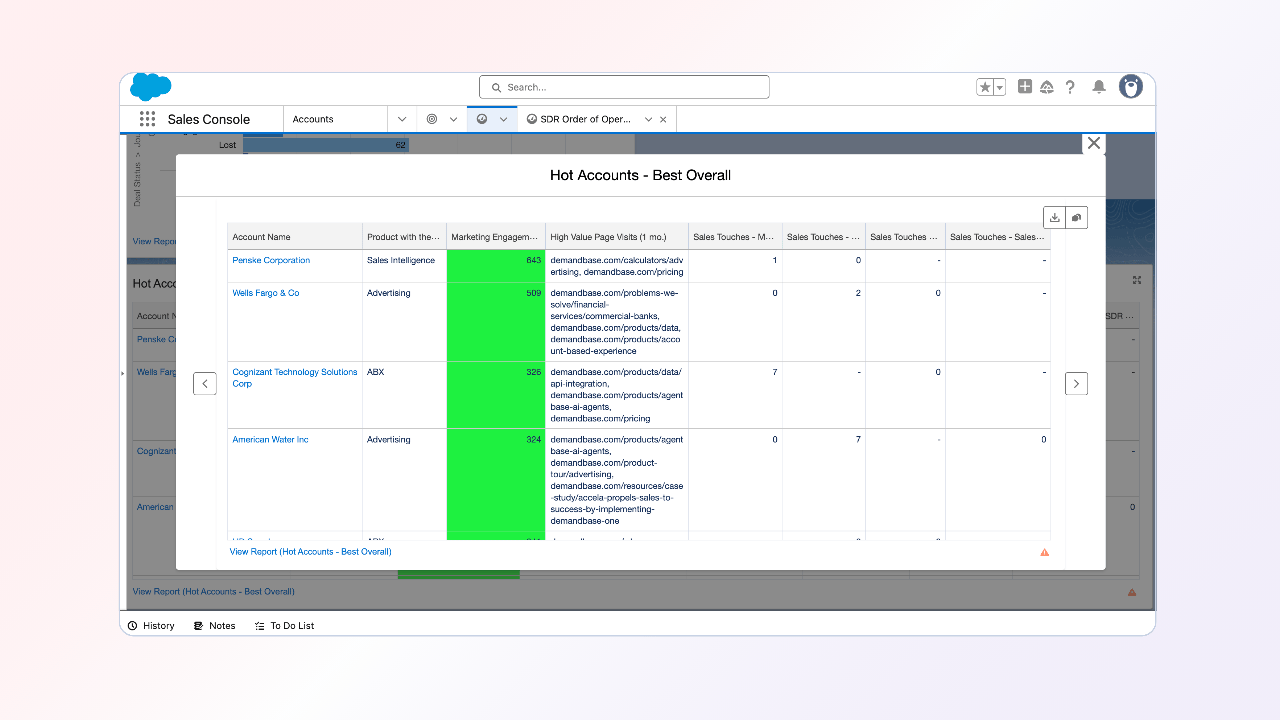
- Purpose: Rank accounts based on engagement across product interest, high-value page views, and active personas.
- Insights Delivered: A comprehensive list of hottest accounts, segmented by interest categories (ABX, Ads, Data, Sales Intelligence).
Closed/Lost Re-Engaged Opportunities Report
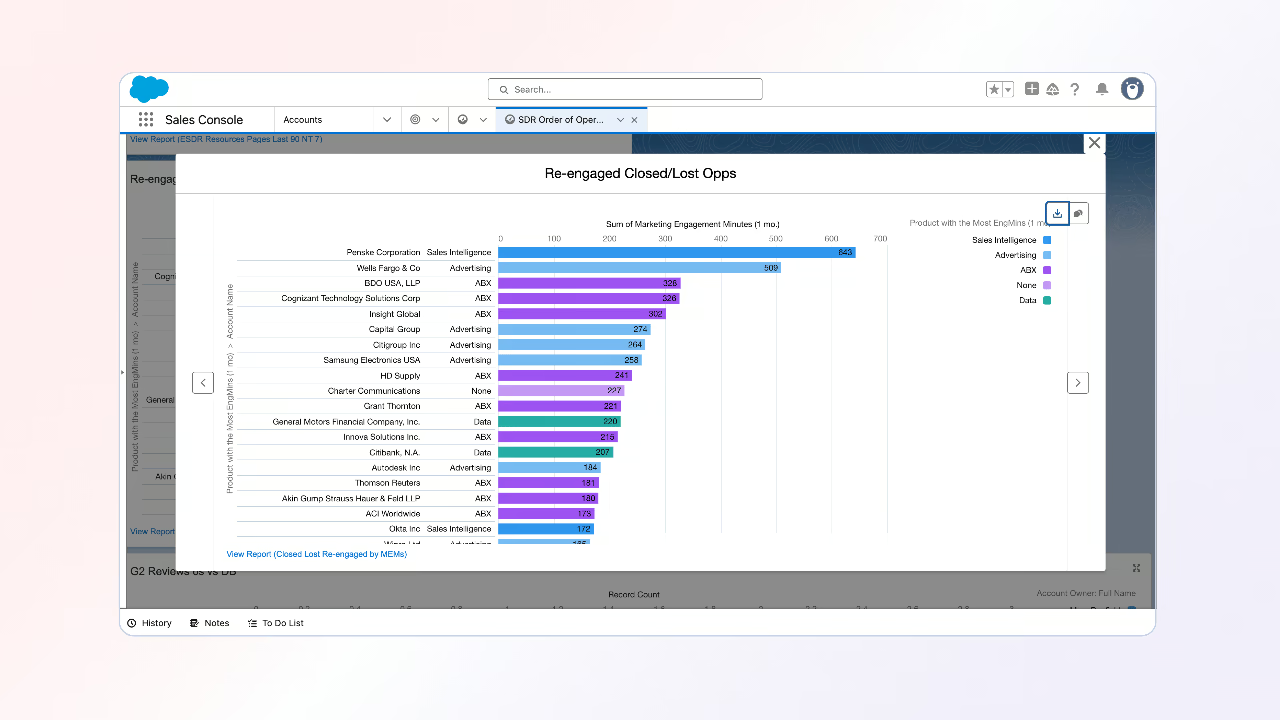
- Purpose: Focus on accounts with >100 engagement points in the past quarter.
- Filters: Filter based on product interest and overall marketing engagement points.
- Actionable Insight: Determine if re-engaging contacts were part of previous sales cycles and align strategies accordingly.
Engaged Personas Report
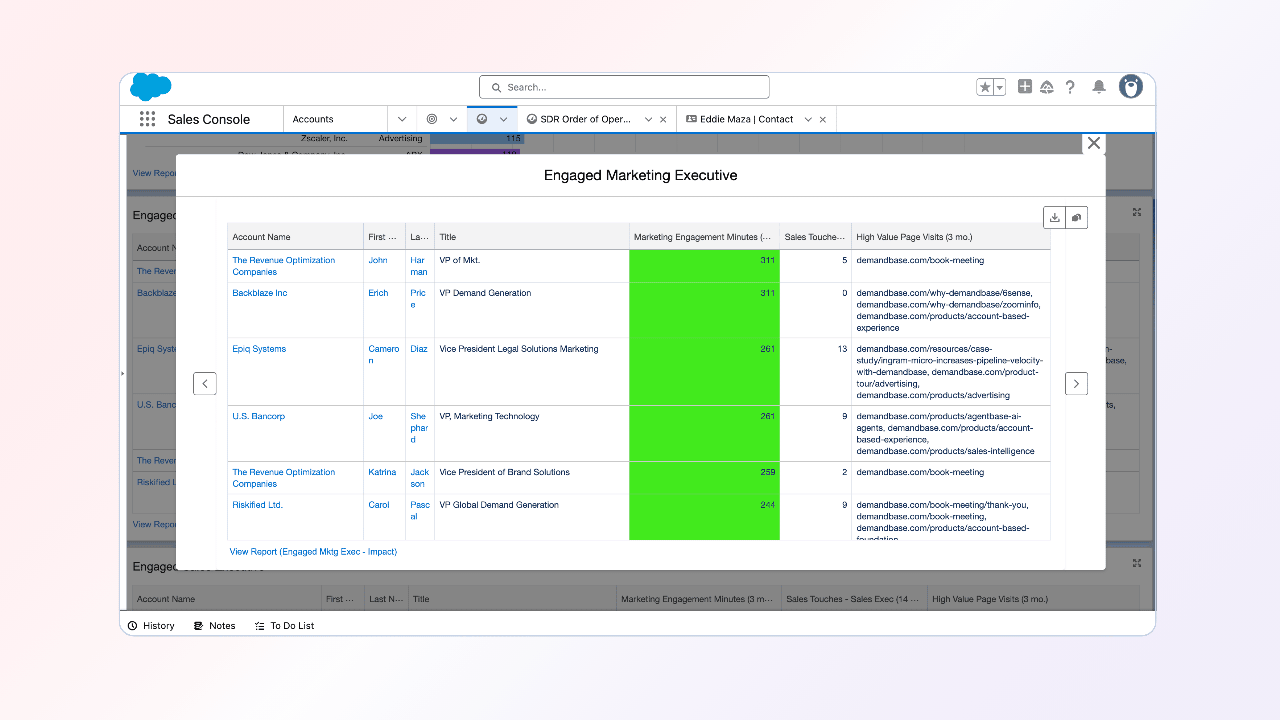
- Purpose: Highlight MQLs and other contacts with high engagement via websites, campaigns, or sales outreach.
- Key Signals: Correlate persona engagement with high-value actions like case study views and campaign participation.
- Actionable Insight: Look for strong buying signals, particularly when multiple individuals within a persona research similar topics.
With these reports, sales leaders can identify where reps should focus, track the impact of ABM strategies, and ensure efficient management of the sales pipeline.
The results
This playbook is for:
- SDRs and AEs: Focus on lead prioritization, personalized outreach, and converting high-value accounts.
- Sales Managers: Oversee team focus and visibility into account engagement to drive pipeline performance.
- Operations Teams: Provide the framework and support for data-driven dashboards and workflow optimization.
And when executed correctly, these are the results you can expect to see:
- Improved Focus: Dashboards and workflows guide teams to focus on accounts with the highest ROI potential.
- Build a Process: Successful teams follow a scalable process. Building these workflows as a part of your sales and marketing strategy will align teams on proven insights and reports that are more likely to convert to pipeline.
- Team Accountability: “Zero-out” lists ensure consistent action across sales teams, driving both individual and team performance.
- Visibility at All Levels: Enhanced clarity for both Sales Management and front-line reps to make data-driven decisions.
Partner with Demandbase Experts
Get tailored strategies and insights to optimize your approach, drive engagement, and unlock new opportunities.
More Playbooks
Learn how to track and optimize buyer engagement throughout your sales cycle. Identify key personas, leverage data insights, and implement multi-threading strategies to close more deals.
Strategy for working accounts
Master account-based selling with tailored 1:1, 1:Few, and 1:Many strategies. Learn to personalize outreach, align with tiers, and drive real results.
Navigating prescriptive sales dashboards
Boost your sales strategies with our 'Navigating Prescriptive Sales Dashboards' playbook. Learn to prioritize accounts, track engagement trends, and tailor outreach for better results.
We have updated our Privacy Notice. Please click here for details.